. 2017 Dec;56(12):2643-2662.
doi: 10.1002/mc.22708. Epub 2017 Aug 30.

NADPH oxidase 5 (NOX5)-induced reactive oxygen signaling modulates normoxic HIF-1α and p27Kip1 expression in malignant melanoma and other human tumors

Affiliations

NADPH oxidase 5 (NOX5)-induced reactive oxygen signaling modulates normoxic HIF-1α and p27Kip1 expression in malignant melanoma and other human tumors

Smitha Antony et al. Mol Carcinog. 2017 Dec.

Abstract

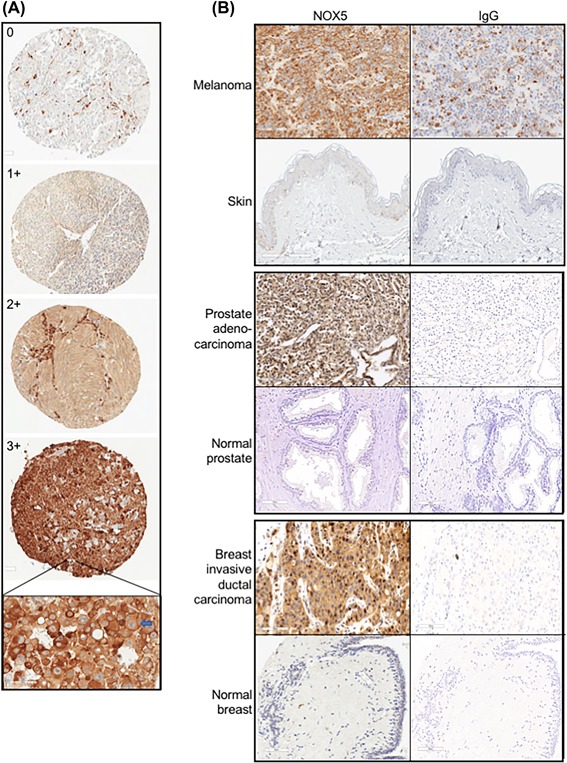
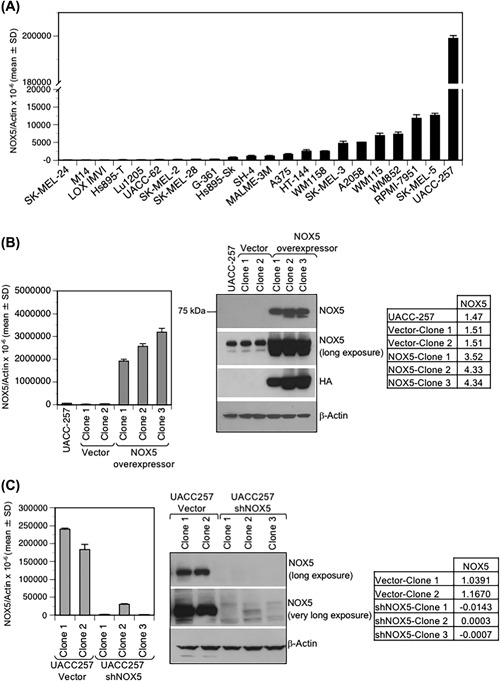
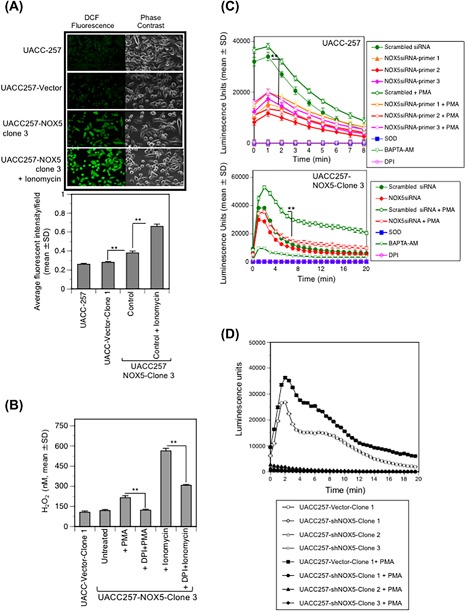
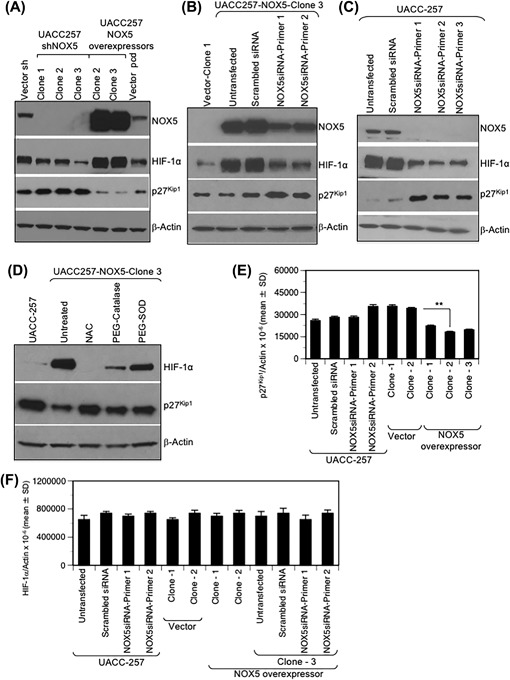
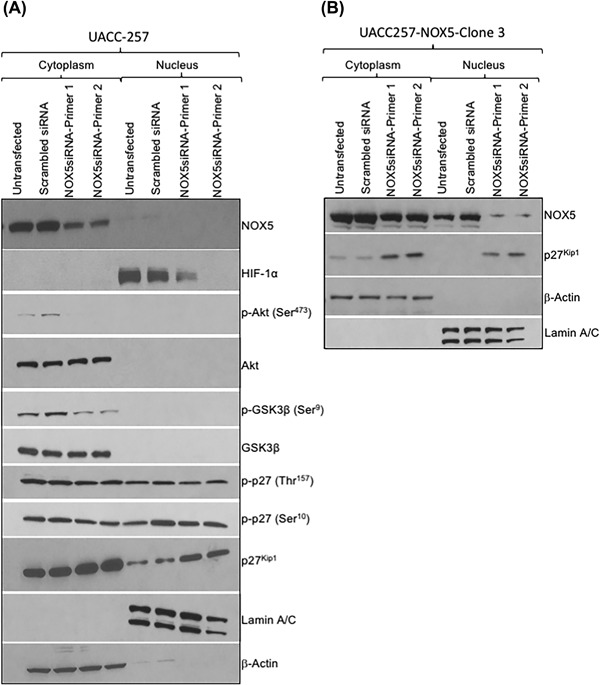
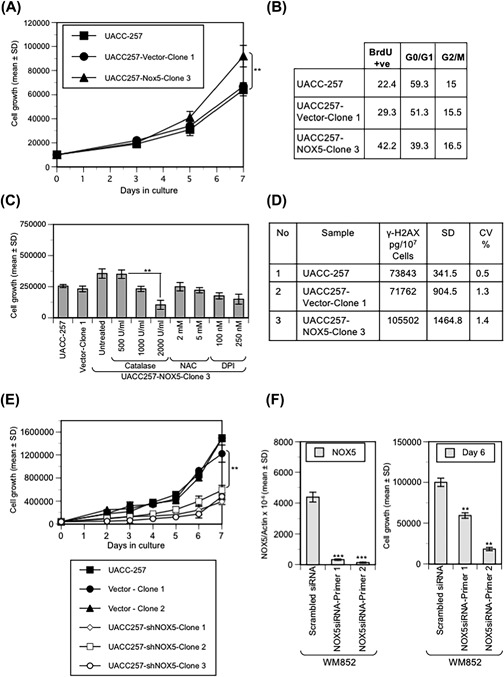
NADPH oxidase 5 (NOX5) generated reactive oxygen species (ROS) have been implicated in signaling cascades that regulate cancer cell proliferation. To evaluate and validate NOX5 expression in human tumors, we screened a broad range of tissue microarrays (TMAs), and report substantial overexpression of NOX5 in malignant melanoma and cancers of the prostate, breast, and ovary. In human UACC-257 melanoma cells that possesses high levels of functional endogenous NOX5, overexpression of NOX5 resulted in enhanced cell growth, increased numbers of BrdU positive cells, and increased γ-H2AX levels. Additionally, NOX5-overexpressing (stable and inducible) UACC-257 cells demonstrated increased normoxic HIF-1α expression and decreased p27Kip1 expression. Similarly, increased normoxic HIF-1α expression and decreased p27Kip1 expression were observed in stable NOX5-overexpressing clones of KARPAS 299 human lymphoma cells and in the human prostate cancer cell line, PC-3. Conversely, knockdown of endogenous NOX5 in UACC-257 cells resulted in decreased cell growth, decreased HIF-1α expression, and increased p27Kip1 expression. Likewise, in an additional human melanoma cell line, WM852, and in PC-3 cells, transient knockdown of endogenous NOX5 resulted in increased p27Kip1 and decreased HIF-1α expression. Knockdown of endogenous NOX5 in UACC-257 cells resulted in decreased Akt and GSK3β phosphorylation, signaling pathways known to modulate p27Kip1 levels. In summary, our findings suggest that NOX5 expression in human UACC-257 melanoma cells could contribute to cell proliferation due, in part, to the generation of high local concentrations of extracellular ROS that modulate multiple pathways that regulate HIF-1α and networks that signal through Akt/GSK3β/p27Kip1 .

Keywords: Akt/GSK3 signaling; DNA damage; NADPH oxidase; cell growth; reactive oxygen species (ROS); tumor microarray (TMA).


Figures

Figure 1
Figure 1
Patterns of expression of NOX5 in human multi‐tumor microarrays. (A) Representative images for NOX5 positivity to define the criteria for 0 (negative), 1+ (weak), 2+(moderate), and 3+ (high positive) scoring of NOX5 staining intensity. All represented images are melanoma cases, ×100 magnification; hematoxylin counterstained. Inset, Strong predominantly cytoplasmic and focal membranous expression of NOX5 in a lymph node metastatic melanoma (blue arrow). Image, ×350 magnification; hematoxylin counterstained. (B) NOX5 expression in malignant melanoma (upper panel), prostate adenocarcinoma (middle panel), and invasive ductal carcinoma of the breast (lower panel) relative to their corresponding normal tissue. IstoypeIgG staining controls are also represented. All images, ×200 magnification; hematoxylin counterstained
Figure 2
Figure 2
NOX5 expression in human melanoma cell lines. Total RNA was extracted from human melanoma cell lines. (A) Quantitative real‐time PCR was carried out to detect endogenous NOX5 expression. Values are expressed relative to β‐Actin. (B and C) Stable overexpression (B) and stable knockdown (C) of NOX5 in UACC‐257 cells. UACC‐257 cells were transfected with either the vector pcDNA 3.1 or pcDNA3‐HA‐NOX5β plasmid for stable NOX5 overexpression (B); and with either scrambled shVector or shNOX5 plasmids for stable NOX5 knockdown (C). Several clones were isolated after G418 selection, of which two clones (Clone 1 and 2) for each of the vector plasmids (pcDNA 3.1 and scrambled sh) and three clones (Clone 1, 2, and 3) for both the NOX5‐overexpressing and NOX5‐knockdown were evaluated for further studies. NOX5 expression was confirmed at the mRNA level (left panel; B and C) and at the protein level (right panel; B and C). To visualize endogenous expression of NOX5 relative to the NOX5 overexpressors and the decrease of NOX5 expression in the NOX5 knockdowns relative to the endogenous NOX5, additional NOX5 (long exposure [2‐5 min] and very long exposure [5‐10 min] of film) panels are represented. The HA‐tag expression confirmed the specificity of the antibody for NOX5 expression. Tables on the right (panels B and C) represent the densitometric expression of NOX5 protein expression (long exposure) relative to that of β‐Actin
Figure 3
Figure 3
Intracellular and extracellular ROS produced by NOX5 in UACC‐257 cells is Ca2+‐ and flavin‐dehydrogenase dependent. (A) upper panel, Ionomycin induces NOX5‐mediated ROS production as measured by confocal microscopy. Live staining of log‐phase UACC‐257 cells was performed as described in section 2. Higher ROS levels were observed in UACC‐NOX5‐clone 3 cells stimulated with ionomycin (1 µmol/L) than in parental or vector transfected clones. Representative confocal images of ROS production as detected by DCF fluorescence (green) and corresponding phase‐contrast fields are shown. The lower panel provides the quantitation of fluorescent intensities for three separate experiments. (B) Extracellular ROS production by overexpression of NOX5 was detected after 30 min of treatment with the phorbol ester PMA (500 nmol/L) or by the Ca2+ ionophore ionomycin (1 µmol/L) using the Amplex Red assay. H2O2 levels were calculated with a standard curve of 0‐2 µmol/L H2O2. The NOX5 enzymatic activity is flavin dehydrogenase‐dependent since pretreatment of cells with the flavoprotein inhibitor DPI (200 nmol/L) for 2 h significantly decreased NOX5‐mediated ROS production. (C) Silencing NOX5 by RNAi significantly inhibited endogenous‐, overexpressed‐, and PMA‐stimulated ROS production. Parental UACC‐257 cells (upper panel) and the NOX5‐overexpressing clone 3 (lower panel) were transiently transfected with either control scrambled siRNA or NOX5‐specific siRNAs targeting different domains of human NOX5 (primers 1‐3). After 72 h of transfection, cells were trypsinized and analyzed for the effects of transient silencing of NOX5 expression on ROS production in the parental and NOX5‐overexpressing cells in the absence and presence of 200 nmol/L PMA (added immediately at the start of the assay) by luminol chemiluminescence assay. To inhibit NOX5 activity, scrambled siRNA control cells were either pretreated with DPI (200 nmol/L) for 2 h in culture medium or treated with BAPTA (10 µmol/L) at the time of the assay. SOD was used to confirm superoxide generation. (D) Log‐phase UACC‐257 cells that have been stably knocked down for NOX5 (UACC‐257‐shNOX5‐clones 1, 2, and 3) and its appropriate vector control cells (UACC257‐Vector‐Clone 1) were trypsinized and analyzed for the effects of stable knockdown of NOX5 expression on ROS production by luminol chemiluminescence assay in the absence and presence of 200 nmol/L PMA (added immediately at the start of the assay). Significant inhibition of both endogenous and PMA‐stimulated ROS production in UACC‐257 cells with stable knockdown of NOX5 expression (UACC‐257‐shNOX5‐clones 1, 2, and 3) relative to the appropriate vector control cells (UACC257‐Vector‐Clone 1) was observed. **, P < 0.01
Figure 4
Figure 4
NOX5 expression levels in human UACC‐257 melanoma cells affect normoxic HIF‐1α and p27Kip1 expression. (A) Whole cell lysates from log‐phase UACC‐257‐vector control clones (scrambled‐sh and pcDNA3.1), UACC257‐shNOX5 clones (1‐3), and UACC257‐NOX5‐overexpressing clones (2 and 3) were prepared and analyzed by Western blotting. NOX5 overexpression in UACC‐257 cells results in decreased p27Kip1 expression as well as increased normoxic HIF‐1α expression. Conversely, decreased normoxic HIF‐1α and corresponding increased p27Kip1 expression was observed in NOX5 knockdown cells. (B and C) Transient knockdown with NOX5‐specific siRNA primers targeting different domains of human NOX5 in the stably overexpressing NOX5 clone (B) and parental UACC‐257 cells (C) results in decreased normoxic HIF‐1α and corresponding increased p27Kip1 expression. (D) Increased normoxic HIF‐1α and decreased p27Kip1 expression observed in NOX5‐overexpressing cells is ROS‐dependent. The NOX5‐overexpressing UACC257 clone was treated with NAC or PEG‐Catalase or PEG‐SOD and examined by Western analysis. Densitometric analysis of western blot analyses (Panels A‐D) of the expression of the various proteins relative to that of β‐Actin are represented in Supplementary Figure S3. (E) Total RNA was isolated from log phase parental UACC‐257 cells, UACC‐257 cells that were transiently transfected with either scrambled control or two different NOX5‐specific siRNAs, and UACC‐257 clones that stably overexpress either NOX5 or the vector. Real‐time PCR analysis of p27Kip1 mRNA expression levels are expressed relative to β‐Actin. (F) Total RNA from parental UACC‐257 cells and stable NOX5‐overexpressing clone 3 cells transiently transfected with either a scrambled siRNA or NOX5‐specific siRNAs, stable vector clones and two additional NOX5 overexpressing clones were isolated. Real‐time PCR analysis of HIF‐1α mRNA levels are expressed relative to β‐Actin. **, P < 0.01
Figure 5
Figure 5
Increased nuclear and cytoplasmic p27Kip1 following knockdown of both endogenous and overexpressed NOX5 in UACC‐257 cells. To assess the translational regulation of p27Kip1 by NOX5, log‐phase parental UACC‐257 cells (A) or UACC‐NOX5 overexpressing clone 3 (B) were transfected with either scrambled or two different NOX5‐specific siRNAs. Nuclear and cytoplasmic extracts were prepared 72 h after transfection, and the expression levels of various proteins were examined by Western analysis. Blots are representative of HIF‐1α, NOX5, Akt, phospho‐Akt (Ser473), GSK3β, phospho‐GSK3β (Ser9), p27Kip1, phospho‐p27Kip1 (Thr157 and Ser10), Lamin A/C, and β‐Actin expression from three independent experiments. Densitometric analyses of the Western blots from panels A and B for the expression of the various proteins are represented in Supplementary Figure S5
Figure 6
Figure 6
NOX5 expression alters the growth and DNA damage levels of UACC‐257 cells. (A) NOX5 overexpression promotes the growth of UACC‐257 cells. Growth of logarithmic phase UACC‐257, vector and NOX5 overexpressing cells was measured by daily cell counts; 10 000 cells were plated in triplicate for each cloned line and the parental cells. The data are expressed as the mean ± SD of three independent experiments, **, P < 0.01. (B) Cell cycle analysis was performed using flow cytometry following BrdU labeling of UACC‐257 parental and each cloned line that were serum‐starved and then released in full growth media for 24 h. The percentage of cells in the different phases of the cell cycle is shown in the table. (C) Effect of antioxidants (NAC and catalase) and the flavoprotein inhibitor diphenyleneiodonium (DPI) was evaluated on the growth of the NOX5 overexpressing cells as measured by cell counts subsequent to 48 h treatment. Data represent the mean ± SD of two independent experiments, **, P < 0.01. (D) γH2AX levels in exponentially growing UACC‐257 parental and cloned lines were quantified using a γH2AX and H2AX sandwich ELISA immunoassay as described in the Materials and Methods section. (E) Stable knockdown of NOX5 expression decreases the growth of UACC‐257 cells. Growth of logarithmic phase UACC‐257, vector, and NOX5 knockdown cells was measured by daily cell counts; 40 000 cells were plated in triplicate for each cloned line and the parental cells. The data are expressed as the mean ± SD of three independent experiments, **, P < 0.01. (F) Effect of transient knockdown of NOX5 expression on cell growth was evaluated in an additional melanoma cell line; WM852. Cells transfected with either scrambled siRNA or NOX5‐specific siRNA primers targeting different domains of human NOX5 were evaluated after 6 days for NOX5 RNA expression (left panel) and for cell growth (right panel) by cell counts. The data are expressed as the mean ± SD of triplicates,**, P < 0.01 and ***, P < 0.001. The experiment was repeated in triplicates with similar results. Representative images of the effect of NOX5 knockdown on the growth of WM852 cells and the effect on ROS production are represented in Supplementary Figure S6

Similar articles

Cited by

References

    1. Lambeth JD, Neish AS. Nox enzymes and new thinking on reactive oxygen: a double‐edged sword revisited. Annu Rev Pathol. 2014; 9:119–145. - PubMed
    1. Burdon RH. Superoxide and hydrogen peroxide in relation to mammalian cell proliferation. Free Radic Biol Med. 1995; 18:775–794. - PubMed
    1. Holmstrom KM, Finkel T. Cellular mechanisms and physiological consequences of redox‐dependent signalling. Nat Rev Mol Cell Biol. 2014; 15:411–421. - PubMed
    1. Droge W. Free radicals in the physiological control of cell function. Physiol Rev. 2002; 82:47–95. - PubMed
    1. Rhee SG. Cell signaling. H2O2, a necessary evil for cell signaling. Science. 2006; 312:1882–1883. - PubMed

MeSH terms

Substances