. 2017 Aug 1:6:e26163.
doi: 10.7554/eLife.26163.

Structural dynamics of RbmA governs plasticity of Vibrio cholerae biofilms

Affiliations

Structural dynamics of RbmA governs plasticity of Vibrio cholerae biofilms

Jiunn Cn Fong et al. Elife. .

Abstract

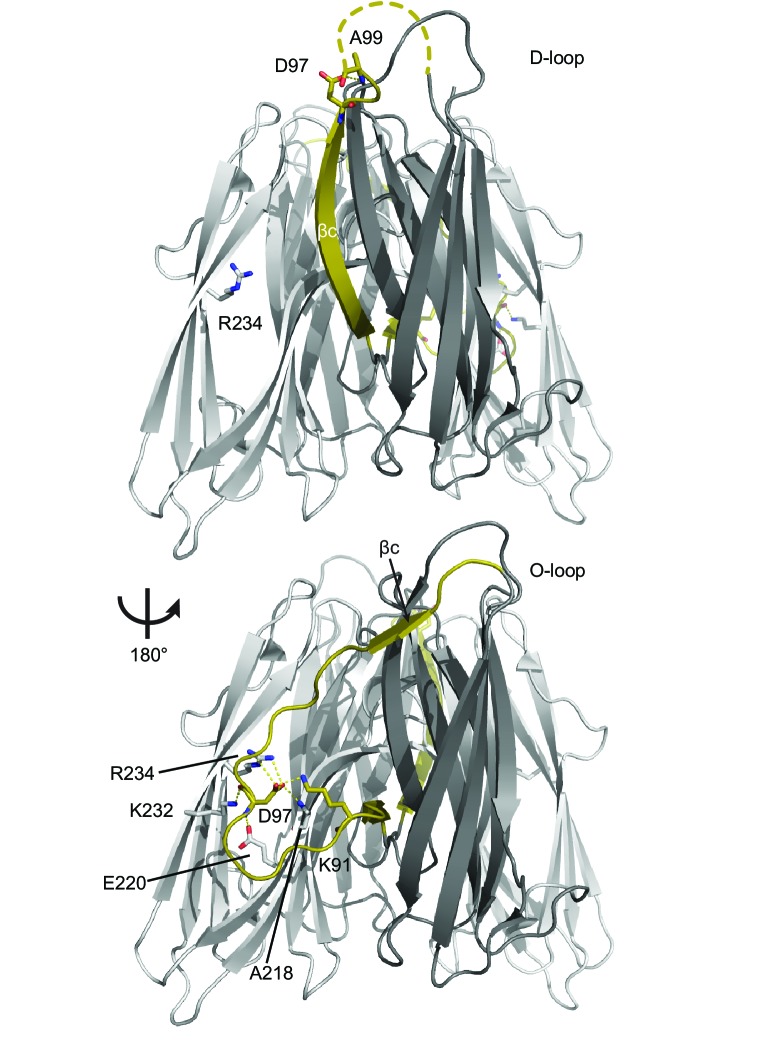
Biofilm formation is critical for the infection cycle of Vibrio cholerae. Vibrio exopolysaccharides (VPS) and the matrix proteins RbmA, Bap1 and RbmC are required for the development of biofilm architecture. We demonstrate that RbmA binds VPS directly and uses a binary structural switch within its first fibronectin type III (FnIII-1) domain to control RbmA structural dynamics and the formation of VPS-dependent higher-order structures. The structural switch in FnIII-1 regulates interactions in trans with the FnIII-2 domain, leading to open (monomeric) or closed (dimeric) interfaces. The ability of RbmA to switch between open and closed states is important for V. cholerae biofilm formation, as RbmA variants with switches that are locked in either of the two states lead to biofilms with altered architecture and structural integrity.

Keywords: RbmA; VPS; Vibrio cholerae; biofilm; biophysics; infectious disease; matrix protein; microbiology; protease; structural biology.


Conflict of interest statement

No competing interests declared.

Figures

Figure 1.
Figure 1.. RbmA binary switch regulates dimerization.
(A) Two views of the RbmA dimer structure (PDB: 4KKP) with the FnIII-1 domain binary switch depicted in its two states (D-loop, O-loop) via surface representation (olive). Dashed line, backbone density missing in crystal structure. (B) Zoomed-in view of residue D97 in the two states of the switch. Residues that make polar contacts to D97 are highlighted. (C) Selected regions of overlaid 1H-15N TROSY-HSQC spectra of full-length 15N RbmA proteins illustrating changes in the two-state equilibrium between wild-type (WT) and mutant proteins. Panels i-iii represent portions of the TROSY-HSQC spectra; FnIII-2 domain residues exhibiting collinear shifts are as follows: (i) T180, (ii) G163, and (iii) S225. More information can be found in Figure 1—figure supplement 2. (D) Analysis of RbmA dimerization state by SEC-MALS. Dashed lines, calculated masses for monomer and dimer masses as indicated.
Figure 1—figure supplement 1.
Figure 1—figure supplement 1.. Larger view of βc switch region.
Two views of the RbmA dimer structure (PDB: 4KKP) with the binary switch depicted in its two states (D-loop, O-loop) in olive; FnIII-1 domain (gray), FnIII-2 domain (white). Dashed line, backbone density missing in crystal structure. Residues that make polar contacts to D97 are highlighted.
Figure 1—figure supplement 2.
Figure 1—figure supplement 2.. Mutations at D97 and R234 influence populations of the binary switch in RbmA.
Full 1H-15N TROSY-HSQC spectra of various full-length 15N RbmA proteins as indicated: (A) R234A, (B) wild-type (WT), (C) D97A, (D) D97K, (E) comparison of spectra for full-length WT RbmA and the cleaved RbmA*. (F) Simplified version of selected regions of overlaid 1H-15N TROSY-HSQC spectra of full-length 15N RbmA proteins illustrating changes in the two-state equilibrium between WT and mutant proteins. (G) Mapping reporter residues onto of the RbmA dimer structure (PDB: 4KKP). The VPS binding site is identified by mapping of significant chemical shifts (Figure 6D, blue) and the location of reporter residues indicated in magenta as follows: i (T180), ii (G163) and iii (S225).
Figure 2.
Figure 2.. Switch mutations at D97 and R234 exert changes in the global structure of RbmA.
(A) Limited proteolysis of full-length wild-type (WT), R234A and D97A mutants in the presence of 1:150 (w/w) ratio of trypsin for the indicated times at room temperature. Tryptic fragments were resolved by 18% SDS-PAGE and visualized by Coomassie stain. Arrows indicate full-length and the predominant cleaved species that is conserved between RbmA WT and D97A, while asterisks (*) indicate the higher molecular weight fragment that is conserved between WT and R234A. (B) Deconvoluted mass spectrometry for tryptic digests of WT and D97A proteins, showing the predominant cleaved species in RbmA WT (~13 kDa and ~26.8 kDa fragments) and D97A (~13 kDa fragment). (C) Location of the cleavage site (red) conserved between WT and D97A proteins mapped onto the RbmA dimer structure (PDB: 4KKP). Western blot analysis of RbmA stability in (D) rugose planktonic and (E) flowcell biofilm cells at various growth phases, and (F) colony biofilm cells after 24 hr of growth. Antibodies against bovine serum albumin (anti-BSA), RNA polymerase (anti-RNAP) and outer membrane protein U (anti-OmpU) were used as additional loading controls. Culture supernatant (CS) fraction fractions were spiked with BSA. WC, whole-cell fraction.
Figure 2—figure supplement 1.
Figure 2—figure supplement 1.. Western blot analysis of RbmA stability in wild-type smooth strain (low-VPS producing strain) at various growth phases.
Anti-BSA was used as an additional loading control. Culture supernatant (CS) fraction fractions were spiked with BSA. WC, whole-cell fraction.
Figure 3.
Figure 3.. RbmA loop conformational transitions impacts biofilm architecture.
(A) Colony corrugation phenotypes and (B) darkfield images of thin-sectioned paraffin-embedded spot colonies after 5 and 2 days of growth, respectively, at 25°C. Scale bars, 0.5 mm (in A), 1 mm (in B). (C) Cell-packing and (D) mature biofilm phenotypes of rugose strain, ΔrbmA and various mutant strains at 6 hr and 24 hr, respectively. Scale bars, 10 μm (in C), 40 μm (in D).
Figure 3—figure supplement 1.
Figure 3—figure supplement 1.. Analysis of RbmA production and degradation.
Western blot analysis of RbmA in culture supernatant (CS) and whole-cell (WC) fractions of rugose, various RbmA strains harboring chromosomal rbmA deletion or point mutations (D97A, D97K and R234A), and HapA, PrtV, IvaP proteases deletion strain (Δ Proteases) after 6 hr of planktonic growth at 30°C. CS and WC fractions at 6 hr show that point mutations did not affect RbmA secretion (CS fractions) and production (WC fractions). Anti-BSA and anti-RNAP were used as additional loading controls. CS fractions were spiked with BSA. RNAP were also used as a control to verify minimal cell lysis in CS fractions. rbmA-R234A strain contains a Myc tag at the C-terminal of RbmA resulting in a slight increase of the molecular mass of RbmA-R234A compared to the other RbmA variants.
Figure 3—figure supplement 2.
Figure 3—figure supplement 2.. Quantitative analysis of (A) biofilm biomass, (B) average biofilm thickness, (C) maximum biofilm thickness, and (D) colony counts (CFU/mL) in the effluent of the biofilms formed by the rugose strain, ΔrbmA and various mutant strains at 24 hr post-inoculation as determined by COMSTAT and dilution plating analysis.
***p<0.0003; **p<0.002; *p<0.04; n.s., not significant. (E) Approximate colony height measurements at 48 hr of rugose parental strain and various mutants. (F) Top-views of spot biofilms of rugose and various mutants used for thin sectioning (in Figure 3B). Scale bar, 1 mm.
Figure 4.
Figure 4.. Biofilm development at single-cell resolution.
(A) Average nearest-neighbor distance between individual cells, measured as a function of time and height of a biofilm colony. At each time point in this heatmap, the spatial variation of the nearest-neighbor distance inside the biofilm colony is represented as a single column, which shows the distribution of the nearest-neighbor distance between cells as a function of height in the biofilm. (B) Reconstructions of biofilms containing approximately 1500 cells, looking at the x-z-plane that cuts through the center of the biofilm colony. Each cell is color-coded according to the local nematic order in its vicinity. Scale bars, 10 μm. (C) RbmA localization within biofilms of rugose, D97A, D97K and R234A strains as a function of time. At each time point in the heatmap, the spatial variation of the intensity of the RbmA immunofluorescence (IRbmA) is represented as a single column, which represents the RbmA abundance as a function of distance from the outer surface of the biofilm.
Figure 4—figure supplement 1.
Figure 4—figure supplement 1.. Nearest-neighbor distance, vertical orientation, radial orientation and volume of individual cell in the biofilms formed by rugose parental strain and various mutants, analyzed at single-cell resolution.
In each row, the same biofilm of a particular strain, indicated on the left, is shown as an x-z-projection (see Figure 4B for a definition of the coordinate system). In each column of the figure, each cell inside a particular biofilm is colored according to either the nearest neighbor distance of the cell, the vertical orientation of the cell, the radial orientation of the cell, and the volume of each cell. The nearest neighbor distance was calculated from cell centroid to cell centroid distances. The vertical orientation of each cell was calculated as the angle of the major axis of the cell with the vertical z-direction. The radial orientation of each cell was calculated as the angle of the cell with the radial vector in spherical coordinates, with an origin at the center of mass in the x-y-plane of the biofilm. Scale bar, 20 μm.
Figure 5.
Figure 5.. VPS binding induces formation of higher order structures in full-length RbmA dimers.
(A) Selected regions of overlaid 1H-15N TROSY-HSQC spectra of full-length 15N RbmA WT (top) and R234A (bottom). Dashed line represents horizontal trace for peak intensity analysis shown above. Blue, spectra of protein alone; Grays, addition of VPS as indicated. (B) Normalized peak intensities for amide and (C) side chain regions of 1H spectra of full-length 15N RbmA proteins in the presence of increasing concentrations of VPS. (D) VPS localization within biofilms of rugose, D97A, D97K and R234A strains at 18 hr post-inoculation. Cells were pseudo-colored blue, while VPS was pseudo-colored red.
Figure 5—figure supplement 1.
Figure 5—figure supplement 1.. VPS preferentially induces peak broadening in closed, dimeric forms of RbmA.
Stacked 1D 1H spectra of various full-length 15N RbmA proteins as indicated: (A) Wild-type (WT). VPS concentration increases from bottom to top as indicated; asterisk indicates new peaks that accumulated at high concentrations of VPS; (B) R234A, (C) D97A, (D) RbmA*.
Figure 6.
Figure 6.. RbmA FnIII-2 domain binds VPS.
(A) Schematic representation of RbmA structure. (B) Zoomed-in regions of 1H-15N HSQC spectra of 15N RbmA proteins in the absence (RbmA*, magenta; FnIII-2 domain, blue) and presence (gray) of 4.5 mg/mL VPS. (C) Total backbone chemical shift perturbations (ΔδTOT) of 15N RbmA FnIII-2 domain upon addition of 4.5 mg/mL VPS. Dashed line, ΔδTOT significance cutoff of 0.05 p.p.m. (D) FnIII-2 domain residues with significantly perturbed chemical shifts (blue) mapped onto RbmA dimer crystal structure (PDB: 4KKP). FnIII-1 domain shown in cartoon representation (gray), and the FnIII-2 domain shown in surface representation (white). (E) VPS-binding site mapped in blue on dimeric RbmA in its low-resolution solution envelope (Giglio et al., 2013) (same domain coloring as above).
Figure 6—figure supplement 1.
Figure 6—figure supplement 1.. Domain mapping and characterization of RbmA FnIII domains.
(A) Schematic representation of RbmA structure with constructs indicated. Color-coding applies throughout the figure. (B) Full-length and spontaneously cleaved RbmA proteins resolved on a 18% SDS polyacrylamide gel. (C) Full-length (FL) and spontaneously cleaved RbmA proteins resolved by size exclusion chromatography on a Superdex 75 10/300 GL analytical column. (D–I) Full 1H-15N HSQC spectra of various 15N RbmA proteins as indicated: (D) comparison of spontaneously cleaved 15N RbmA full-length (FL) before (gray) and after (orange) filtration with a 3 kDa MW cutoff filter to remove small peptide fragments, (E) comparison of 15N RbmA* (magenta) and the post-filtration cleaved full-length protein (orange), (F) comparison of 15N RbmA* (magenta) and the isolated 15N FnIII-2 domain (blue), (G) isolated 15N FnIII-1 domain, (H) isolated 15N FnIII-2 domain, (I) comparison of isolated 15N FnIII-2 domain (blue) and the post-filtration cleaved full-length protein (orange).
Figure 6—figure supplement 2.
Figure 6—figure supplement 2.. NMR analysis of the FnIII-2 domain R234A mutation.
(A) Schematic representation of RbmA structure with constructs and mutation indicated. Color-coding applies throughout the figure. (B) Full 1H-15N HSQC spectrum of 15N FnIII-2 domain with R234A mutation. (C) Comparison of full 1H-15N HSQC spectra from 15N wild-type and R234A FnIII-2 domains. (D) Total backbone chemical shift perturbations of 15N RbmA FnIII-2 domain upon R234A mutation. Solid line, mean perturbation +1 s.d.; dashed line, mean +2 s.d. (E) Significant chemical shift perturbations from R234A mutation (dark blue) and VPS binding (Figure 6D, blue) mapped onto RbmA dimer crystal structure (PDB: 4KKP).
Figure 6—figure supplement 3.
Figure 6—figure supplement 3.. Complementation by FnIII domains and RbmA*.
Colony morphology of rugose and ΔrbmA strains carrying vector only, and ΔrbmA harboring various expression plasmids grown in the absence (top) and presence (bottom) of IPTG inducer after 3 days of growth at 25°C. Scale bar, 0.5 mm.
Figure 7.
Figure 7.. Models of various RbmA variants and their involvement in biofilm formation.
(A) Cartoon models representing the various RbmA oligomerization and switch states. The VPS binding is indicated in blue on the FnIII-2 domain (white); dashed line indicates flexible or unfolded protein. The binary switch is represented exclusively in the open state (D-loop conformation) in the D97A/D97K mutants, and at partial occupancy in the WT protein, while the R234A mutant depicts the binary switch in its closed state (O-loop conformation). Dimeric forms of RbmA (WT, R234A) are drawn in their elongated form, as supported by small angle x-ray scattering studies in solution (Giglio et al., 2013). (B) Cell organization and RbmA localization in the biofilms of rugose, ΔrbmA and various rbmA mutants. RbmA, represented in purple, is distributed between the surface and the center of the biofilms in rugose and D97 mutants; while in R234A mutant, RbmA localizes at the center of the biofilm with decrease abundance towards the surface. VPS represented in blue and enhanced VPS localization around the biofilm cluster is represented as a thick blue line.

Comment in

  • Flipping the switch.
    Pierrat X, Persat A. Pierrat X, et al. Elife. 2017 Sep 19;6:e31082. doi: 10.7554/eLife.31082. Elife. 2017. PMID: 28926339 Free PMC article.
  • Biofilms: The architect of the biofilm.
    York A. York A. Nat Rev Microbiol. 2017 Oct 12;15(11):642-643. doi: 10.1038/nrmicro.2017.127. Nat Rev Microbiol. 2017. PMID: 29021602 No abstract available.

References

    1. Absalon C, Van Dellen K, Watnick PI. A communal bacterial adhesin anchors biofilm and bystander cells to surfaces. PLoS Pathogens. 2011;7:e1002210. doi: 10.1371/journal.ppat.1002210. - DOI - PMC - PubMed
    1. Bao Y, Lies DP, Fu H, Roberts GP. An improved Tn7-based system for the single-copy insertion of cloned genes into chromosomes of gram-negative bacteria. Gene. 1991;109:167–168. doi: 10.1016/0378-1119(91)90604-A. - DOI - PubMed
    1. Berk V, Fong JC, Dempsey GT, Develioglu ON, Zhuang X, Liphardt J, Yildiz FH, Chu S. Molecular architecture and assembly principles of Vibrio cholerae biofilms. Science. 2012;337:236–239. doi: 10.1126/science.1222981. - DOI - PMC - PubMed
    1. Beyhan S, Yildiz FH. Smooth to rugose phase variation in Vibrio cholerae can be mediated by a single nucleotide change that targets c-di-GMP signalling pathway. Molecular Microbiology. 2007;63:995–1007. doi: 10.1111/j.1365-2958.2006.05568.x. - DOI - PubMed
    1. Borlee BR, Goldman AD, Murakami K, Samudrala R, Wozniak DJ, Parsek MR. Pseudomonas aeruginosa uses a cyclic-di-GMP-regulated adhesin to reinforce the biofilm extracellular matrix. Molecular Microbiology. 2010;75:827–842. doi: 10.1111/j.1365-2958.2009.06991.x. - DOI - PMC - PubMed

MeSH terms

Substances