Review
. 2017 Sep;67(5):378-397.
doi: 10.3322/caac.21405. Epub 2017 Aug 1.

Obesity and adverse breast cancer risk and outcome: Mechanistic insights and strategies for intervention

Affiliations
Review

Obesity and adverse breast cancer risk and outcome: Mechanistic insights and strategies for intervention

Manuel Picon-Ruiz et al. CA Cancer J Clin. 2017 Sep.

Abstract

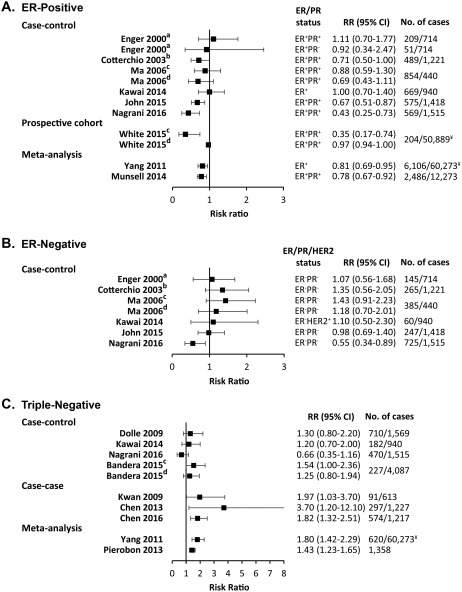
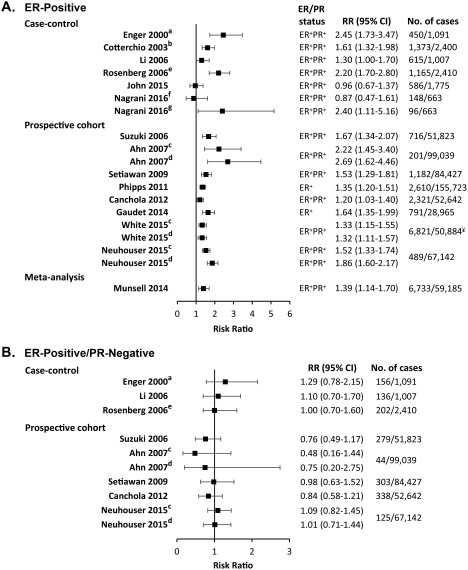
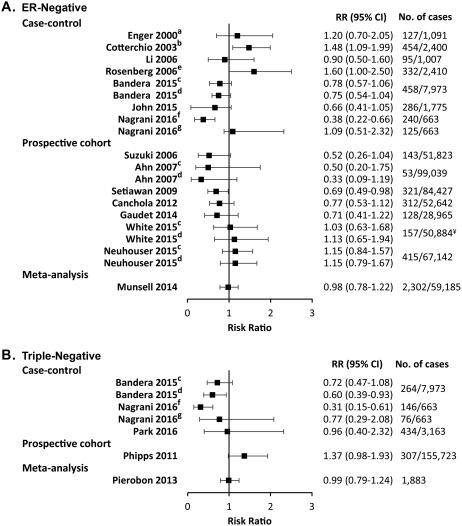
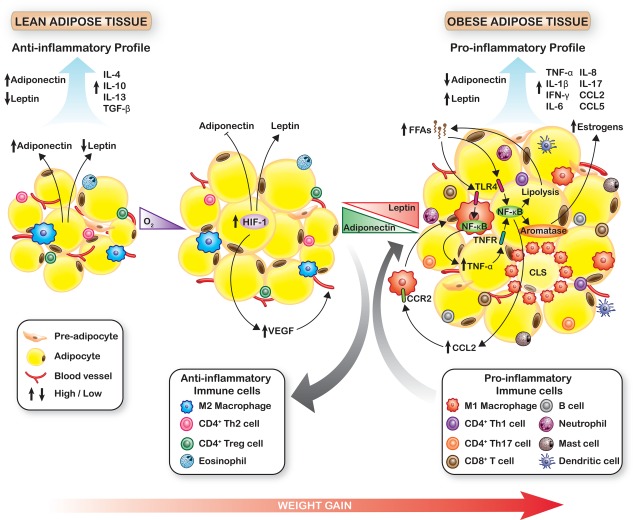
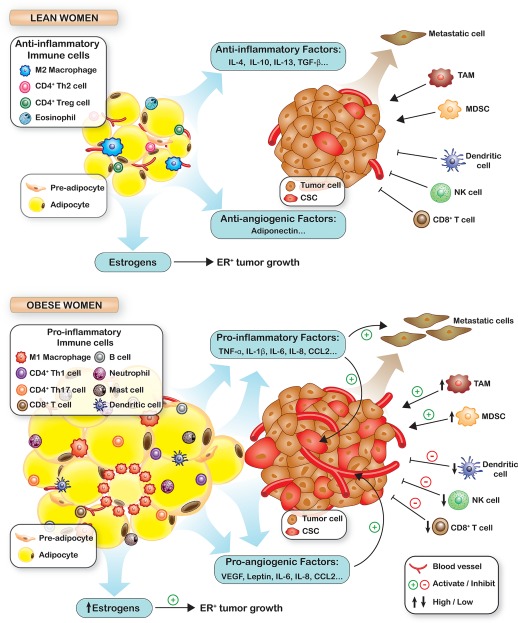
Answer questions and earn CME/CNE Recent decades have seen an unprecedented rise in obesity, and the health impact thereof is increasingly evident. In 2014, worldwide, more than 1.9 billion adults were overweight (body mass index [BMI], 25-29.9 kg/m2 ), and of these, over 600 million were obese (BMI ≥30 kg/m2 ). Although the association between obesity and the risk of diabetes and coronary artery disease is widely known, the impact of obesity on cancer incidence, morbidity, and mortality is not fully appreciated. Obesity is associated both with a higher risk of developing breast cancer, particularly in postmenopausal women, and with worse disease outcome for women of all ages. The first part of this review summarizes the relationships between obesity and breast cancer development and outcomes in premenopausal and postmenopausal women and in those with hormone receptor-positive and -negative disease. The second part of this review addresses hypothesized molecular mechanistic insights that may underlie the effects of obesity to increase local and circulating proinflammatory cytokines, promote tumor angiogenesis and stimulate the most malignant cancer stem cell population to drive cancer growth, invasion, and metastasis. Finally, a review of observational studies demonstrates that increased physical activity is associated with lower breast cancer risk and better outcomes. The effects of recent lifestyle interventions to decrease sex steroids, insulin/insulin-like growth factor-1 pathway activation, and inflammatory biomarkers associated with worse breast cancer outcomes in obesity also are discussed. Although many observational studies indicate that exercise with weight loss is associated with improved breast cancer outcome, further prospective studies are needed to determine whether weight reduction will lead to improved patient outcomes. It is hoped that several ongoing lifestyle intervention trials, which are reviewed herein, will support the systematic incorporation of weight loss intervention strategies into care for patients with breast cancer. CA Cancer J Clin 2017;67:378-397. © 2017 American Cancer Society.

Keywords: breast cancer; diet and exercise; hormone receptor; immunity; inflammatory cytokines; nuclear factor kappa B (NF-κB); obesity; postmenopausal and premenopausal; sex steroids; weight loss.


Figures

Figure 1
Figure 1
Forest Plots for the Association of Premenopausal Breast Cancer Risk and Body Mass Index. Body mass index (BMI) is compared between obese (BMI >30 kg/m2) and normal‐weight (BMI <25 kg/m2) women for (A) estrogen receptor‐positive (ER+) or/and progesterone receptor‐positive (PR+) breast cancer from case‐control studies (Kawai et al,19 Cotterchio et al,22 Ma et al,23 John et al,24 Nagrani et al,25 and Enger et al26), a prospective cohort study (White et al14), and meta‐analyses (Yang et al27 and Munsell et al28); (B) ER‐negative/PR‐negative (ERPR) and human epidermal growth factor 2‐positive (Her2+) or unknown breast cancer from case‐control studies (Kawai et al,19 Cotterchio et al,22 Ma et al,23 John et al,24 Nagrani et al,25 and Enger et al26); and (C) triple‐negative breast cancer from case‐control studies (Kawai,19 Nagrani,25 Dolle et al,31 and Bandera et al33), case‐case‐studies (Kwan et al,30 Chen et al,32 and Chen et al34), and meta‐analyses (Yang et al27 and Pierobon et al36). Risk ratio (RR) estimates include odds ratios, rate ratios, and hazard ratios. No. of cases indicates the number of premenopausal breast cancer cases/controls (for case‐control studies) or premenopausal breast cancer cases/total population (prospective cohort, case‐case studies, and meta‐analyses). ¥ indicates the total number of women (not only premenopausal). Superscript letters indicate studies that compared: awomen with a BMI ≥27.1 kg/m2 versus < 21.7 kg/m2; bwomen with a BMI >27 kg/m2 versus ≤25 kg/m2; cwomen with grade I obesity (30‐34.99 kg/m2) versus normal‐weight women; and dwomen with grade II and III obesity (>35 kg/m2) versus normal‐weight women. 95% CI indicates 95% confidence interval.
Figure 2
Figure 2
Forest Plots for the Association of Postmenopausal Breast Cancer Risk and Body Mass Index. Body mass index (BMI) is compared between obese (BMI > 30 kg/m2) and normal‐weight (BMI < 25 kg/m2) women for (A) estrogen receptor‐positive (ER+) and progesterone receptor‐positive (PR+) or unknown breast cancer from case‐control studies (Cotterchio et al,22 John et al,23 Nagrani et al,25 Enger et al,26 Rosenberg et al51, and Li et al42), prospective cohort studies (White et al,14 Neuhouser et al,43 Suzuki et al,48 Ahn et al,49 Setiawan et al,50 Phipps et al,52 Canchola et al,54 and Gaudet et al55), and a meta‐analysis (Munsell28); and (B) ER+ PR‐negative (PR) breast cancer from case‐control studies (Enger et al,26 Li et al,42 and Rosenberg et al51) and prospective cohort studies (Neuhouser et al,43 Suzuki et al,48 Ahn et al,49 Setiawan et al,50 and Canchola et al54). Risk ratio (RR) estimates included odds ratios, rate ratios, and hazard ratios. No. of cases indicates the number of postmenopausal breast cancer cases/control (case‐control studies) or postmenopausal breast cancer cases/total population (prospective cohort studies and meta‐analysis). ¥ indicates the total number of women (not only premenopausal). Superscript letters indicate studies that compared: awomen with a BMI ≥27.1 kg/m2 versus ≥21.7 kg/m2; bwomen with a BMI > 27 kg/m2 versus ≤25 kg/m2; cwomen with grade I obesity (30‐34.99 kg/m2) versus normal‐weight women; dwomen with grade II and III obesity (>35 kg/m2) versus normal‐weight women; ewomen with a BMI ≥28.3 kg/m2 versus <22.2 kg/m2; fwomen who were postmenopausal for less than 10 years; and gwomen who were postmenopausal for 10 years or more. 95% CI indicates 95% confidence interval.
Figure 3
Figure 3
Forest Plots for the Association of Postmenopausal Breast Cancer Risk and Body Mass Index. Body mass index (BMI) is compared between obese (BMI > 30 kg/m2) and normal‐weight (BMI < 25 kg/m2) women for (A) estrogen receptor‐negative/progesterone receptor‐negative and human epidermal growth factor receptor 2‐unknown breast cancer from case‐control studies (Cotterchio et al,22 John et al,23 Nagrani et al,25 Enger et al,26 Rosenberg et al51, Bandera et al,33 and Li et al,42), prospective cohort studies (White et al,14 Neuhouser et al,43 Suzuki et al,48 Ahn et al,49 Setiawan et al,50 Canchola et al,54 and Gaudet et al55), and a meta‐analysis (Munsell et al28); and (B) triple‐negative breast cancer from case‐control studies (Nagrani et al,25 Bandera et al,33 and Park et al58), a prospective cohort study (Phipps et al52), and a meta‐analysis (Pierobon et al36). Risk ratio (RR) estimates included odds ratios, rate ratios, and hazard ratios. No. of cases indicates the number of postmenopausal breast cancer cases/control (case‐control studies) or postmenopausal breast cancer cases/total population (prospective cohort studies and meta‐analysis). ¥ indicates the total number of women, not only those who were premenopausal. Superscript letters indicate studies that compared: awomen with a BMI ≥ 27.1 kg/m2 versus <21.7 kg/m2; bwomen with a BMI > 27 kg/m2 versus ≤25 kg/m2; cwomen with grade I obesity (30‐34.99 kg/m2) versus normal‐weight women; dwomen with grade II and III obesity (>35 kg/m2) versus normal‐weight women; ewomen with a BMI ≥ 28.3 kg/m2 versus <22.2 kg/m2; fwomen who were postmenopausal for less than 10 years; and gwomen who were postmenopausal for 10 years or more. 95% CI indicates 95% confidence interval.
Figure 4
Figure 4
Changes in Adipose Tissue During Weight Gain. During obese adipose tissue expansion, preadipocyte differentiation is impaired, and hypoxia activates hypoxia‐inducible factor 1 (HIF‐1) to decrease adiponectin expression and upregulate leptin. HIF‐1 also promotes angiogenesis by turning on vascular endothelial growth factor (VEGF). The altered leptin:adiponectin ratio promotes proinflammatory immune cell infiltration and the formation of crown‐like structures (CLS). Dying adipocytes release free fatty acids (FFAs), which bind toll‐like receptor 4 (TLR4) on macrophages and adipocytes to activate nuclear factor kappa B (NF‐κB) and upregulate secretion of inflammatory cytokines, including tumor necrosis factor α (TNF‐α), interleukin‐6 (IL‐6), IL‐8, chemokine (C‐C motif) ligand 5 (CCL5), and CCL2. These cytokines promote lipolysis and FFA release to further activate the NF‐κB pathway, which also increases aromatase expression and estrogen synthesis. CCL2 and other cytokines serve as chemoattractants to recruit monocytes/macrophages. These feed‐forward loops establish a chronic inflammatory milieu in obese adipose tissue. IFN‐γ indicates interferon gamma; TGF‐β, transforming growth factor beta; TNFR, tumor necrosis factor receptor; Th1, T‐helper 1 cells; Th17, T‐helper 17 cells; Treg, T‐regulatory cells.
Figure 5
Figure 5
The Role of Obesity in Tumorigenesis. With obesity, secreted cytokines shift from an anti‐inflammatory profile to a proinflammatory/proangiogenic profile. Proinflammatory and proangiogenic cytokine secretion also increases upon adipocyte:breast cancer cell contact to increase angiogenesis, cancer stem cell expansion, invasion, and metastasis. In obese adipose tissue, mediators of antitumor immunity, such as CD8‐positive (CD8+) T cells, natural killer (NK) cells, and dendritic cells, decrease and myeloid‐derived suppressor cells (MDSCs) and tumor‐associated macrophages (TAMs) that suppress antitumor immunity accumulate. High aromatase levels drive higher estrogen synthesis to support estrogen receptor‐positive (ER+) breast cancer growth. CCL indicates chemokine (C‐C motif) ligand; IL, interleukin; TGF‐β, transforming growth factor β; TNF‐α, tumor necrosis factor α; VEGF, vascular endothelial growth factor.

References

    1. World Health Organization . Obesity and Overweight. Fact Sheet 311 (Reviewed May 2014). Geneva, Switzerland: World Health Organization; 2014.
    1. Ogden CL, Carroll MD, Fryar CD, Flegal KM. Prevalence of Obesity Among Adults and Youth: United States, 2011‐2014. NCHS Data Brief, no. 201. Hyattsville, MD: National Center for Health Statistics; 2015. - PubMed
    1. Gonzalez N, Moreno‐Villegas Z, Gonzalez‐Bris A, Egido J, Lorenzo O. Regulation of visceral and epicardial adipose tissue for preventing cardiovascular injuries associated to obesity and diabetes [serial online]. Cardiovasc Diabetol. 2017;16:44. - PMC - PubMed
    1. Eckel RH, Kahn SE, Ferrannini E, et al. Obesity and type 2 diabetes: what can be unified and what needs to be individualized? J Clin Endocrinol Metab. 2011;96:1654‐1663. - PMC - PubMed
    1. International Agency for Research on Cancer/World Health Organization . Weight Control and Physical Activity. IARC Handbook of Cancer Prevention. Vol 6 Lyon, France: IARC Publications; 2002.