. 2017 Aug 1;58(10):3896-3922.
doi: 10.1167/iovs.17-21721.

β1-Integrin Deletion From the Lens Activates Cellular Stress Responses Leading to Apoptosis and Fibrosis

Affiliations

β1-Integrin Deletion From the Lens Activates Cellular Stress Responses Leading to Apoptosis and Fibrosis

Yichen Wang et al. Invest Ophthalmol Vis Sci. .

Abstract

Purpose: Previous research showed that the absence of β1-integrin from the mouse lens after embryonic day (E) 13.5 (β1MLR10) leads to the perinatal apoptosis of lens epithelial cells (LECs) resulting in severe microphthalmia. This study focuses on elucidating the molecular connections between β1-integrin deletion and this phenotype.

Methods: RNA sequencing was performed to identify differentially regulated genes (DRGs) in β1MLR10 lenses at E15.5. By using bioinformatics analysis and literature searching, Egr1 (early growth response 1) was selected for further study. The activation status of certain signaling pathways (focal adhesion kinase [FAK]/Erk, TGF-β, and Akt signaling) was studied via Western blot and immunohistochemistry. Mice lacking both β1-integrin and Egr1 genes from the lenses were created (β1MLR10/Egr1-/-) to study their relationship.

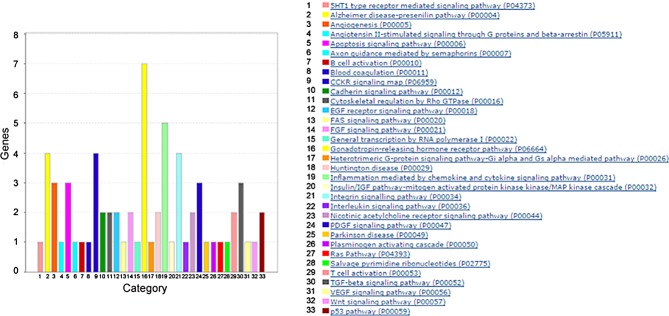
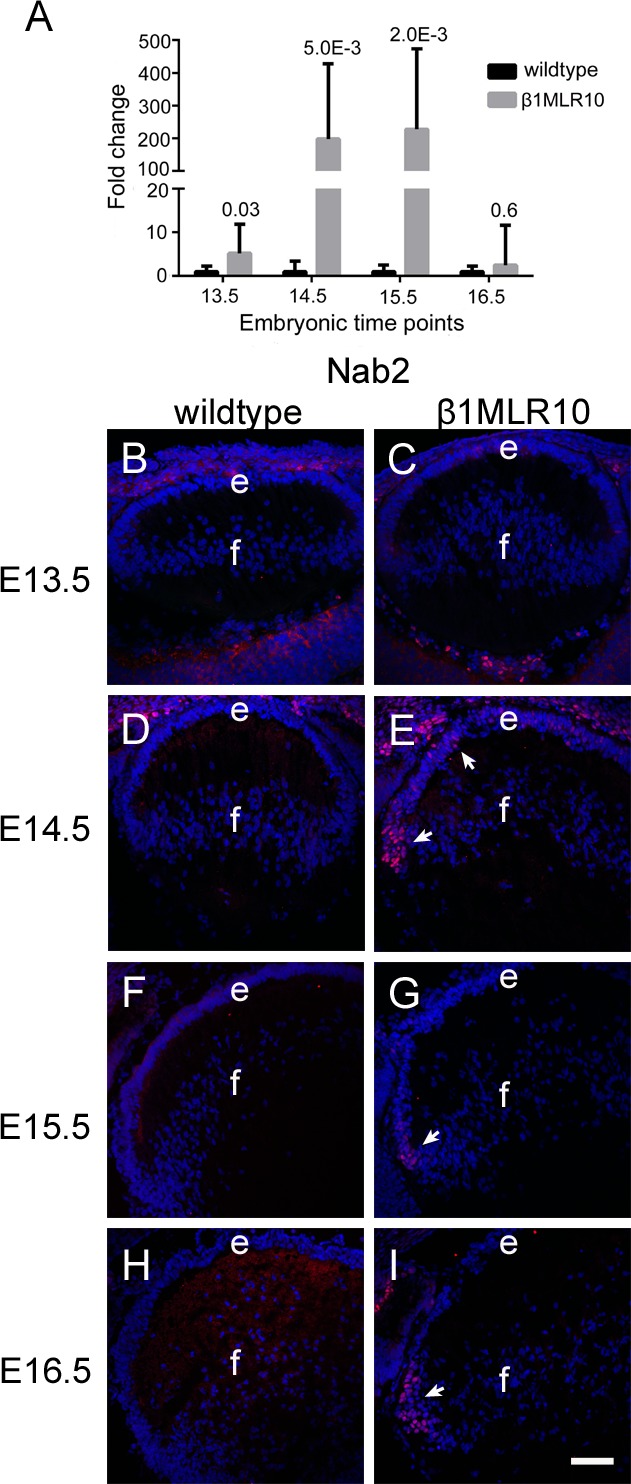
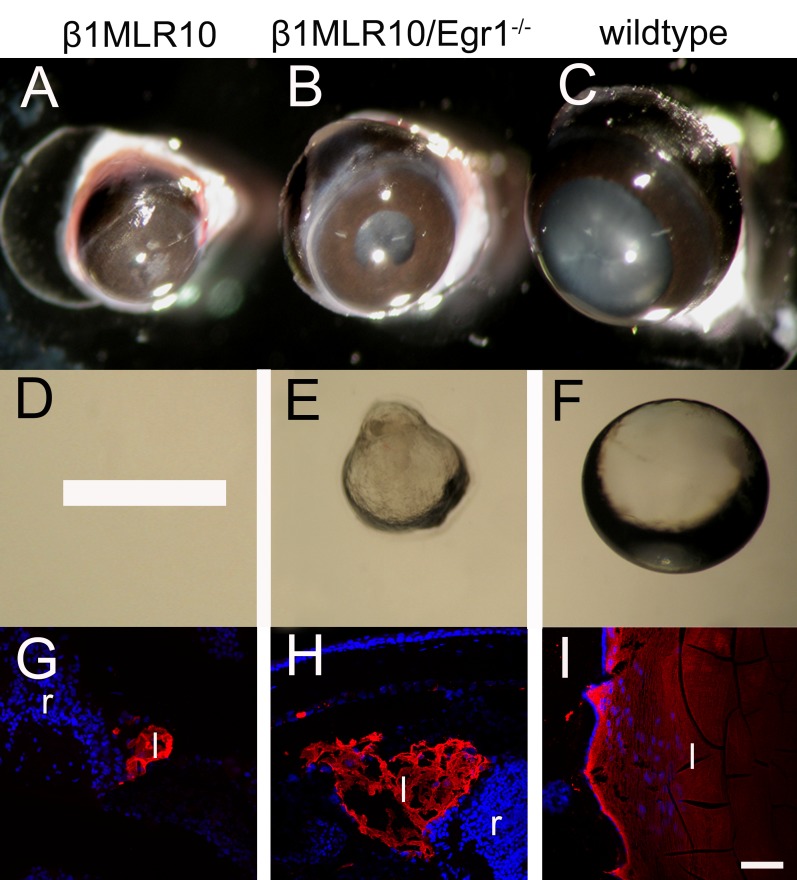
Results: RNA sequencing identified 120 DRGs that include candidates involved in the cellular stress response, fibrosis, and/or apoptosis. Egr1 was investigated in detail, as it mediates cellular stress responses in various cell types, and is recognized as an upstream regulator of numerous other β1MLR10 lens DRGs. In β1MLR10 mice, Egr1 levels are elevated shortly after β1-integrin loss from the lens. Further, pErk1/2 and pAkt are elevated in β1MLR10 LECs, thus providing the potential signaling mechanism that causes Egr1 upregulation in the mutant. Indeed, deletion of Egr1 from β1MLR10 lenses partially rescues the microphthalmia phenotype.

Conclusions: β1-integrin regulates the appropriate levels of Erk1/2 and Akt phosphorylation in LECs, whereas its deficiency results in the overexpression of Egr1, culminating in reduced cell survival. These findings provide insight into the molecular mechanism underlying the microphthalmia observed in β1MLR10 mice.


Figures

Figure 1
Figure 1
PANTHER gene ontology-based pathway analysis (http://pantherdb.org/) of 120 genes differentially regulated in β1MLR10 lenses compared with WT at E15.5. The bar chart shows the 33 most represented pathways in which that 120 DRGs were predicted to participate. The number of genes involved in each pathway ranged from one to seven, and most of them included just one to two genes. The top five pathways shown were gonadotropin-releasing hormone receptor pathway (seven genes: Fos, Nab2, Nab1, Ptgfr, Egr1, Mmp14, Junb), inflammation mediated by chemokine and cytokine signaling pathway (five genes: Alox12, Acta2, Pak1, Col6a3, Junb), Alzheimer disease–presenilin pathway (four genes: Mmp2, Acta2, Erbb4, Mmp14), integrin signaling pathway (four genes: Acta2, Itgb8, Col6a3, Col26a1), and CCKR signaling (four genes: Fos, Arhgap4, Pak1, Egr1).
Figure 2
Figure 2
qRT-PCR analysis of (A) αSMA, (B) Anxa2, (C) Mmp14 (Matrix metalloprotease 14/membrane type I matrix metalloproteinase), and (D) Plat mRNA expression in WT and β1MLR10 lenses from E13.5 to E16.5. (A) Compared with WT, the expression of αSMA was significantly higher in β1MLR10 lenses from E14.5 to E16.5. (B) Compared with WT, the expression of Anxa2 was significantly higher in β1MLR10 lenses from E13.5 to E15.5. The elevation in Anxa2 mRNA at E16.5 was not significant due to the high SD of the data. (C) Compared with WT, the expression of MMP14 was significantly higher in β1MLR10 lenses from E13.5 to E15.5. The elevation in MMP14 mRNA at E16.5 was not statistically significant due to the high SD of the data. (D) Compared with WT, the expression of Plat was significantly higher in β1MLR10 lenses from E13.5 to E15.5. The elevation in Plat mRNA at E16.5 was not significant due to the high SD of the data. Error bars represent SD. Statistical significance was determined with nested ANOVA and is given above the error bar in the figure.
Figure 3
Figure 3
Analysis of Smad phosphorylation in E16.5 WT and β1MLR10 lenses. (A) Representative WB comparing pSmad3 levels in WT and β1MLR10 lenses. (B) Quantitation of the pSmad3 levels in WT and β1MLR10 lenses showing that pSmad3 levels were significantly lower in β1MLR10 lenses compared with WT (*P = 0.023, n = 4). (C–F) IF staining for pSmad3 (red) and αSMA (green) in WT (C, D) and β1MLR10 (E, F) lenses at E16.5. Qualitatively, pSmad3 staining was reduced in β1MLR10 LECs compared with WT. (G) Representative WB comparing pSmad1/5/8 levels between E16.5 WT and β1MLR10 lenses. (H) WB quantitation showing that pSmad1/5/8 levels in E16.5 WT and β1MLR10 lenses were not significantly different (P = 0.18, n = 4). (I–L) IF staining for pSmad1/5/8 (red) and αSMA (green) in WT (I, J) and β1MLR10 (K, L) lenses at E16.5. Qualitatively fewer LECs of β1MLR10 lenses had detectable levels of pSmad1/5/8 compared with WT. Blue, DNA; (C–F) red, pSmad3; (I–L) red, pSmad1/5/8; green, αSMA; e, epithelial cell; f, fiber cell. Scale bar: 38 μm.
Figure 4
Figure 4
Analysis of pFAK and pErk1/2 levels in E16.5 WT and β1MLR10 lenses. (A) A representative WB comparing pFAK (Y397) levels between WT and β1MLR10 lenses. (B) WB quantitation showing that pFAK levels were significantly reduced in E16.5 β1MLR10 lenses compared with WT (P ≤ 0.001, n = 3). (C) A representative WB comparing Erk1/2 and pErk1/2 levels between WT and β1MLR10 lenses. (D) WB quantitation showing that neither pErk1 nor pErk2 levels were significantly different in E16.5 β1MLR10 lenses compared with WT (pErk1 P = 0.41; pErk2, P = 0.11; n = 4). (E, F) IHC localization of pErk1/2 (brown) in E16.5 WT (E) and β1MLR10 (F) lenses. Both WT and β1MLR10 lenses exhibit pErk1/2 staining in in the newly formed lens fibers at the transition zone. However, β1MLR10 lenses also exhibit strong pErk1/2 staining in the lens epithelium (arrows), whereas little to no pErk1/2 is seen in the epithelial cells of WT lenses. Blue, DNA; brown, pErk1/2 (E, F); e, lens epithelium; f, lens fiber cells; tz, transition zone. Scale bar: 39 μm.
Figure 5
Figure 5
Developmental expression pattern of Egr1 in WT and β1MLR10 lenses. (A) qRT-PCR analysis of Egr1 mRNA in WT and β1MLR10 lenses from E13.5-E16.5, showing that Egr1 mRNA levels were significantly elevated in β1MLR10 lenses at all stages examined. (B–I) IF localization of Egr1 protein (red) in WT and β1MLR10 lenses from E13.5 to E16.5. At E13.5, no Egr1 protein was detected in WT (B) lenses, whereas a few Egr1-positive cell nuclei (arrow) were seen at the central epithelium of β1MLR10 lenses ([C] arrows). At E14.5, no Egr1 protein was detected in WT lenses (D); however, many Egr1-positive nuclei (arrows) were seen throughout the β1MLR10 lens epithelium. At E15.5, no Egr1 protein was detected in WT lenses (F); however, Egr1 protein was seen in numerous nuclei of the peripheral β1MLR10 lens epithelium ([G] arrows). At E16.5, no Egr1 protein was detected in WT lenses (H), whereas Egr1 protein was detected in islands of nuclei in the LECs closest to the transition zone of β1MLR10 lenses (arrow). (B–I) Blue, DNA; red, Egr1; e, epithelial cell; f, fiber cell. Scale bar: 71 μm. Error bars in (A) represent SD. Statistical significance was determined with nested ANOVA and is given above the error bar in the figure. *Nonspecific staining as determined by non-nuclear distribution and its presence in WT lenses that express very little Egr1 mRNA.
Figure 6
Figure 6
The putative promoters of genes differentially regulated in β1MLR10 lenses are enriched in Egr1 DNA-binding motifs. (A) Sequence logo for the JASPAR core Egr1 binding site based on the previously reported Egr1 position weight matrix. (B) Motif enrichment analysis revealed a statistically significant enrichment of Egr1 DNA-binding motifs in the putative regulatory regions 2.5 kb upstream of TSS of DRGs identified in β1MLR10 lenses. The start and end positions of the promoter region that matches the Egr1 DNA-binding motif (5′ to 3′; position relative to TSS) for each candidate DRG are given. Upregulated DRGs are indicated in red, and downregulated DRGs are indicated in green.
Figure 7
Figure 7
Developmental expression pattern of Nab2 in WT and β1MLR10 lenses. (A) qRT-PCR analysis of Nab2 mRNA in WT and β1MLR10 lenses from E13.5 to E16.5, showing that Nab2 mRNA levels were significantly elevated in β1MLR10 lenses between E13.5 and E15.5, whereas these levels were similar in WT at E16.5. (B–I) IF localization of Nab2 protein (red) in WT and β1MLR10 lenses from E13.5 to E16.5. At E13.5, no Nab2 protein was detected in either WT (B) or β1MLR10 lenses (C). At E14.5, no Nab2 protein was detected in WT lenses (D); however, Nab2-positive nuclei (arrows) were seen in the peripheral β1MLR10 lens epithelium. At E15.5, no Nab2 protein was detected in WT lenses (F); however, Nab2 protein was seen in a few nuclei of the peripheral β1MLR10 lens epithelium (G, arrow). At E16.5, no Nab2 protein was detected in WT lenses (H), whereas Nab2 protein was detected in islands of nuclei in the LECs closest to the transition zone of β1MLR10 lenses (arrow). (B–I) Blue, DNA; red, Nab2; e, epithelial cell; f, fiber cell. Scale bar: 71 μm. Error bars in (A) represent SD. Statistical significance was determined with nested ANOVA and is given above the error bar in the figure.
Figure 8
Figure 8
Developmental expression pattern of Egr1 and Nab2 in WT and β1LE lenses. (A–D) Sections from E11.5 eyes stained for Egr1 (red, [A, B]) and Nab2 (red, [C, D]). (A) WT lenses lack Egr1 immunoreactivity at E11.5, whereas (B) Egr1-positive nuclei (arrows) were detected in the lens vesicle of E11.5 β1LE lenses. (C) No Nab2 immunostaining was detected in WT lenses at E11.5. (D) Nab2-positive nuclei (arrows) were found in the lens vesicle of E11.5 β1LE lenses. (E–H) Sections from E13.5 eyes stained for Egr1 (red, [E, F]) and Nab2 (red, G, H). Both WT (E) and β1LE lenses (F) showed no Egr1 immunoreactivity at E13.5. (G) No Nab2 immunostaining was observed in WT lenses at E13.5, whereas (H) many Nab2-positive nuclei (arrows) were found in the abnormally differentiating fiber cells in E13.5 β1LE lenses. (A–H) Blue, DNA; (A, B) and (E, F) red, Egr1; (C, D) and (G, H) red, Nab2; lv, lens vesicle; r, retina; e, lens epithelium; f, lens fibers. Scale bar: 71 μm (A–H).
Figure 9
Figure 9
Deletion of Egr1 from β1MLR10 mice partially rescues the lens phenotype. (A) An eye isolated from a 2-month-old β1MLR10 mouse. (B) An eye isolated from a β1MLR10/Egr1−/− mouse, showing that the microphthalmia is less severe in mice lacking Egr1. (C) An eye isolated from a WT mouse showing the relative size of a normal mouse eye. (D) No lens tissue was isolatable from β1MLR10 eyes via dissection. (E) Bright-field micrograph of a lens isolated from a 2-month-old β1MLR10/Egr1−/− mouse, showing that it is smaller than normal and not transparent. (F) Bright-field micrograph of a lens isolated from a 2-month-old WT mouse. (G) IF detection of Aquaporin0 (red) in a section from a 2-month-old β1MLR10 eye, showing that these eyes contain very few cells expressing the marker of lens fiber cells at this age. (H) IF detection of Aquaporin0 (red) in a section from a 2-month-old β1MLR10/Egr1−/− eye, showing that these eyes have much more tissue staining for aquaporin0 (red), although the lens is still profoundly abnormal. (I) IF detection of aquaporin0 (red) in a section from a 2-month-old WT eye, showing the normal distribution of aquaporin0 in lens fibers. (G–I) Blue, DNA; red, Aquaporin0; l, lens; r, retina. Scale bar: 71 μm.
Figure 10
Figure 10
Analysis of apoptosis and fiber cell differentiation markers in β1MLR10/Egr1−/− lenses. (A–C) IF of cleaved Caspase 3 (red) in newborn lenses. WT lenses (A) exhibit no cleaved Caspase 3 immunoreactivity under the conditions used. Intense cleaved Caspase 3 immunoreactivity was seen in both the lens fibers and epithelium (arrow) of β1MLR10 lenses (B), whereas little to no cleaved Caspase 3 immunoreactivity was seen in newborn β1MLR10/Egr1−/− lenses (C). (D–F) TUNEL staining of newborn lenses. WT lenses exhibit no TUNEL-positive nuclei (green) at birth (D), whereas TUNEL staining was detected in both the epithelial cells and fibers of both β1MLR10 (E) and β1MLR10/Egr1−/− lenses (F) (arrows). (G–I) Immunolocalization of cMaf in E16.5 lenses. WT lenses (G) exhibit strong cMaf labeling in the transition zone nuclei in the midst of differentiating into lens fiber cells. cMaf staining is seen in a similar pattern in β1MLR10 lenses, although the number of positive nuclei appears expanded (H). β1MLR10/Egr1−/− lenses (I) appear to exhibit brighter cMaf staining overall, and this staining extends farther into the lens epithelium than either WT or β1MLR10 lenses. (J–L) Immunolocalization of Prox1 in E16.5 lenses. WT lenses (J) exhibit strongest Prox1 labeling in the transition zone nuclei in the midst of differentiating into lens fiber cells, whereas some Prox1 protein is detected in LECs at this age. Prox1 staining is seen in a similar pattern in β1MLR10 lenses, although positive nuclei are brighter in LECs than in control (K). β1MLR10/Egr1−/− lenses (I) stain more intensely for Prox1 immunoreactivity in LECs than either WT or β1MLR10 lenses. (A–L) Blue, DNA; (A–C) red, cleaved Caspase 3; (D–F) green, TUNEL positive; (G–I) red, cMaf; (J–L) red, Prox1; e, epithelial cells; f, fiber cells. (A–F) Scale bar: 142 μm; (G–I) scale bar: 62 μm; (J–L) scale bar: 142 μm.
Figure 11
Figure 11
Molecular phenotype of β1MLR10/Egr1−/− lenses. (A–C) Sections from E16.5 eyes stained for β1-integrin (red) and α-smooth muscle actin (green). E16.5 WT lenses (A) exhibit β1-integrin immunoreactivity (red) in both lens epithelium and fiber cells. The intense β1-integrin staining at the lens periphery is in the tunica vasculosa (arrows). E16.5 β1MLR10 (B) and β1MLR10/Egr1−/− (C) lenses lack β1-integrin immunoreactivity in lens tissue, but retain the intense β1-integrin immunoreactivity in the tunica vasculosa (arrows). (D–F) The αSMA (green) channel alone of the images shown in (A–C). No αSMA immunoreactivity was detected in WT lenses (D) at E16.5; however, both β1MLR10 (E) and β1MLR10/Egr1−/− (F) lenses exhibit αSMA immunoreactivity (green, arrows). (G–I) Sections from E16.5 eyes stained for Nab2. (G) WT lenses lack Nab2 immunoreactivity at E16.5. (H) Nab2-positive nuclei are detected in the peripheral epithelium of E16.5 β1MLR10 lenses. (I) No Nab2 immunostaining was detected in β1MLR10/Egr1−/− lenses. (A–C and G–I) Blue, DNA; (A–F) green, αSMA; (A–C) red, β1-integrin; (G–I) red, Nab2; e, lens epithelium; f, lens fibers. Scale bar: 142 μm (A–F); scale bar: 71 μm (G–I).

Similar articles

Cited by

References

    1. Zampighi GA, Eskandari S, Kreman M. . Epithelial organization of the mammalian lens. Exp Eye Res. 2000; 71: 415– 435. - PubMed
    1. Bassnett S, Shi Y, Vrensen GF. . Biological glass: structural determinants of eye lens transparency. Philos Trans R Soc Lond B Biol Sci. 2011; 366: 1250– 1264. - PMC - PubMed
    1. Danysh BP, Duncan MK. . The lens capsule. Exp Eye Res. 2009; 88: 151– 164. - PMC - PubMed
    1. Mathias RT, Kistler J, Donaldson P. . The lens circulation. J Membr Biol. 2007; 216: 1– 16. - PubMed
    1. Joy A, Al-Ghoul KJ. . Basal membrane complex architecture is disrupted during posterior subcapsular cataract formation in Royal College of Surgeons rats. Mol Vis. 2014; 20: 1777– 1795. - PMC - PubMed

Publication types