

Epigenome profiling and editing of neocortical progenitor cells during development
- PMID: 28765163
- PMCID: PMC5579386
- DOI: 10.15252/embj.201796764
Epigenome profiling and editing of neocortical progenitor cells during development
Abstract
The generation of neocortical neurons from neural progenitor cells (NPCs) is primarily controlled by transcription factors binding to DNA in the context of chromatin. To understand the complex layer of regulation that orchestrates different NPC types from the same DNA sequence, epigenome maps with cell type resolution are required. Here, we present genomewide histone methylation maps for distinct neural cell populations in the developing mouse neocortex. Using different chromatin features, we identify potential novel regulators of cortical NPCs. Moreover, we identify extensive H3K27me3 changes between NPC subtypes coinciding with major developmental and cell biological transitions. Interestingly, we detect dynamic H3K27me3 changes on promoters of several crucial transcription factors, including the basal progenitor regulator Eomes We use catalytically inactive Cas9 fused with the histone methyltransferase Ezh2 to edit H3K27me3 at the Eomes locus in vivo, which results in reduced Tbr2 expression and lower basal progenitor abundance, underscoring the relevance of dynamic H3K27me3 changes during neocortex development. Taken together, we provide a rich resource of neocortical histone methylation data and outline an approach to investigate its contribution to the regulation of selected genes during neocortical development.
Keywords: Cas9; epigenome; histone methylation; neocortical development; neural progenitor cell.
© 2017 The Authors.
Figures
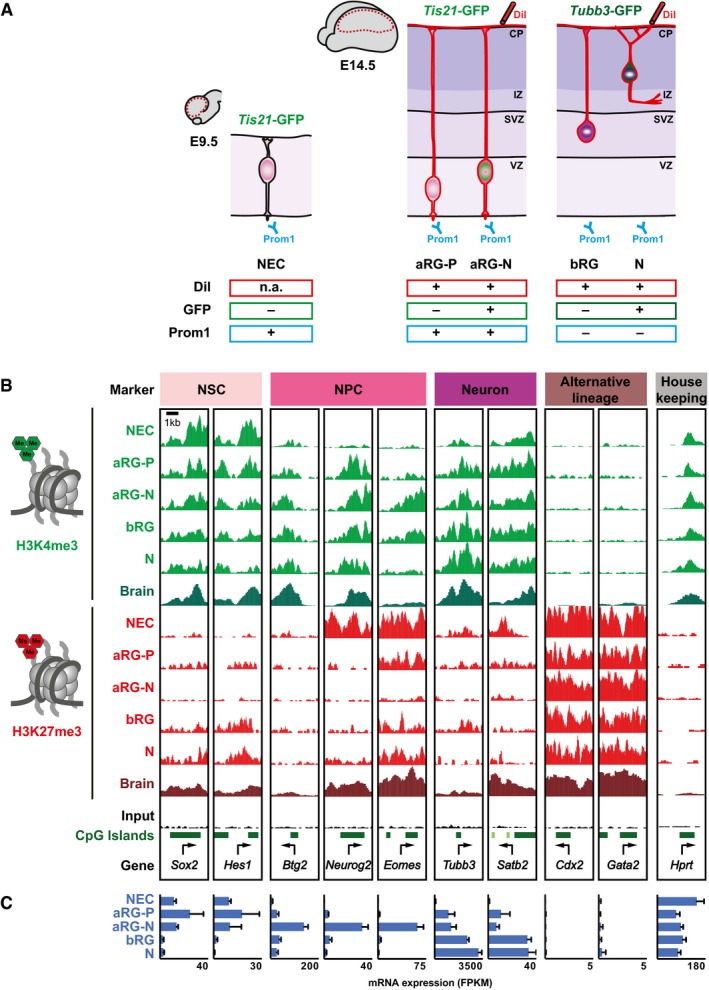
Schematic overview of the transgenic mouse lines and markers used to isolate distinct neural progenitor cell types and neurons from the developing mouse neocortex (Florio et al, 2015): NECs at E9.5; aRG‐P, aRG‐N, bRG, and neurons (N) at E14.5 (collectively referred to as defined neural cell populations). Dashed red lines in the brain cartoons indicate dissected area.
H3K4me3 (green) and H3K27me3 (red) ChIP‐seq signals around selected TSS (± 2 kb) in the defined neural cell populations. Genes were selected to represent the distinct cell states indicated on top. For comparison, E14.5 whole‐brain (Brain) ChIP‐seq profiles from ENCODE/LICR are shown.
mRNA expression of genes shown in (B), analyzed by RNA‐seq. RNA‐seq data for RG and neurons are from Florio et al (2015), and those for NEC were determined here. Error bars represent SD of four or five biological replicates.
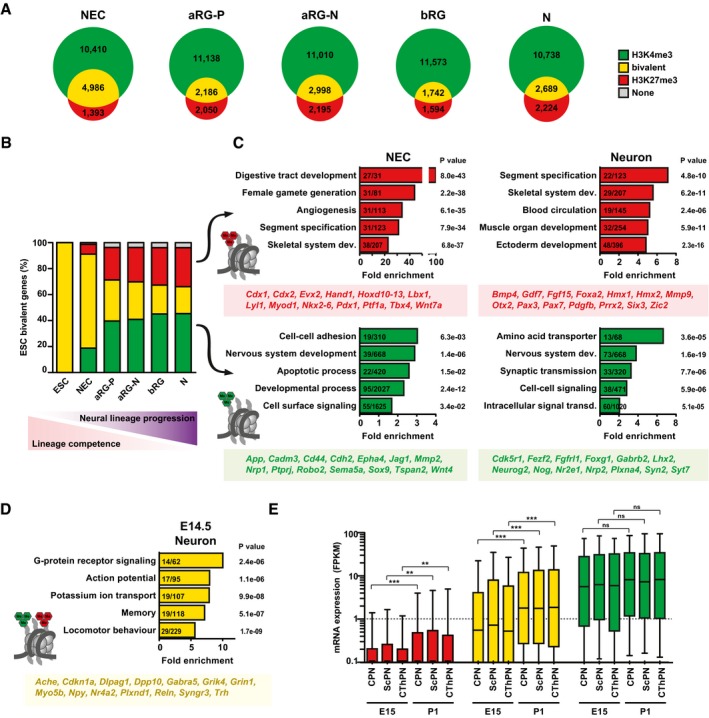
Venn diagrams showing the numbers of genes with significant H3K4me3 peaks, H3K27me3 peaks, or both, for each of the defined neural cell populations.
The genes that were previously identified to be bivalent in mouse ESC (Mikkelsen et al, 2007; Mohn et al, 2008; n = 2,491, yellow) were analyzed for the percentage of H3K4me3 (green), H3K27me3 (red), bivalent (yellow), or no modifications (gray), in the defined neural cell populations, that is, during neural lineage progression.
GO term enrichment analysis of those ESC‐bivalent genes that are resolved to either H3K27me3 (top) or H3K4me3 (bottom) in NECs (left) or up to neurons (right), as shown in (B). The five GO term clusters with the lowest P‐value are shown (category: biological process). The number of genes present in the tested list over the number of genes in the reference gene set is indicated within the bars. The P‐value is given next to each bar. Example genes present in the four groups are given below each graph.
GO term enrichment analysis of ESC‐bivalent genes that remain bivalent in E14.5 neurons.
The genes marked by H3K27me3 (red), bivalent genes (yellow), and the genes marked by H3K4me3 (green) in E14.5 neurons (see B) were analyzed for their mRNA expression shown as box plots (expressed in FPKM) during subsequent neuronal differentiation in specific neuron subpopulations at E15 and postnatal day 1 (P1), using the data of Molyneaux et al (2015); CPN, callosal projection neurons; ScPN, subcerebral projection neurons; CThPN, corticothalamic projection neurons. Boxes represent first quartile (bottom), median, and third (top) quartile; whiskers refer to 10th and 90th percentiles. Log scale was used to facilitate viewing of FPKM values in the lower range. Significance was calculated using a Kruskal–Wallis test; **P < 0.01; ***P < 0.0001.
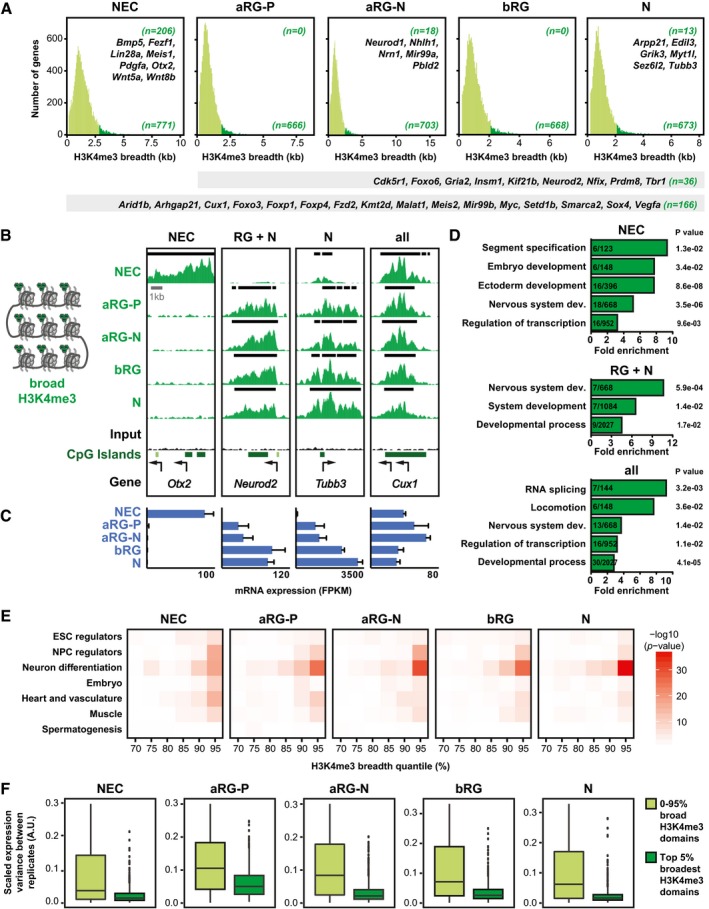
Breadth distributions of H3K4me3 ChIP‐seq peaks at TSS (± 2 kb) in the defined neural cell populations. The 5% broadest H3K4me3 peaks are highlighted in dark green for each cell type, with the number of such genes shown in the bottom right corner of each graph. The numbers of genes that are specific to one cell type and a number of example genes are shown in the top right corner. The numbers of genes that are found in all of the defined neural cell populations or in the four E14.5 neural cell populations and a number of example genes are shown in the gray bars below the graphs.
Example ChIP‐seq tracks for genes with broad H3K4me3 peaks. Black lines above each track indicate significant peaks (called with MACS2). Arrows indicate TSS. Note that for the ChIP‐seq data for Tubb3, a larger region around the TSS is shown than in Fig 1B.
mRNA expression for genes shown in (B), analyzed by RNA‐seq. Error bars represent SD of four or five biological replicates.
GO term enrichment analysis of genes marked by broad H3K4me3 peaks in NECs (top), all radial glia (RG) plus neurons (N, middle), or all cell types (bottom). The five GO term clusters with the lowest P‐value are shown (category: biological process).
For each neural cell type shown, previously identified genes implicated in different biological categories (see Dataset EV6) were plotted against H3K4me3 peak breadth, binned into 5% quantiles. Significance of enrichment is presented as −log10(P‐value) and was calculated using Fisher's exact test.
Transcriptional variability of genes with the top 5% broadest H3K4me3 domains compared to remaining genes (0–95% H3K4me3 domains), based on RNA‐seq data. Significance was calculated with a Wilcoxon rank sum test with continuity correction and is < 2.2e‐16 for all cell types. Boxes represent first quartile (Q1, bottom), median, and third quartile (Q3, top); whiskers refer to 1.5 × IQR (interquartile range); dots represent outliers.
- A, B
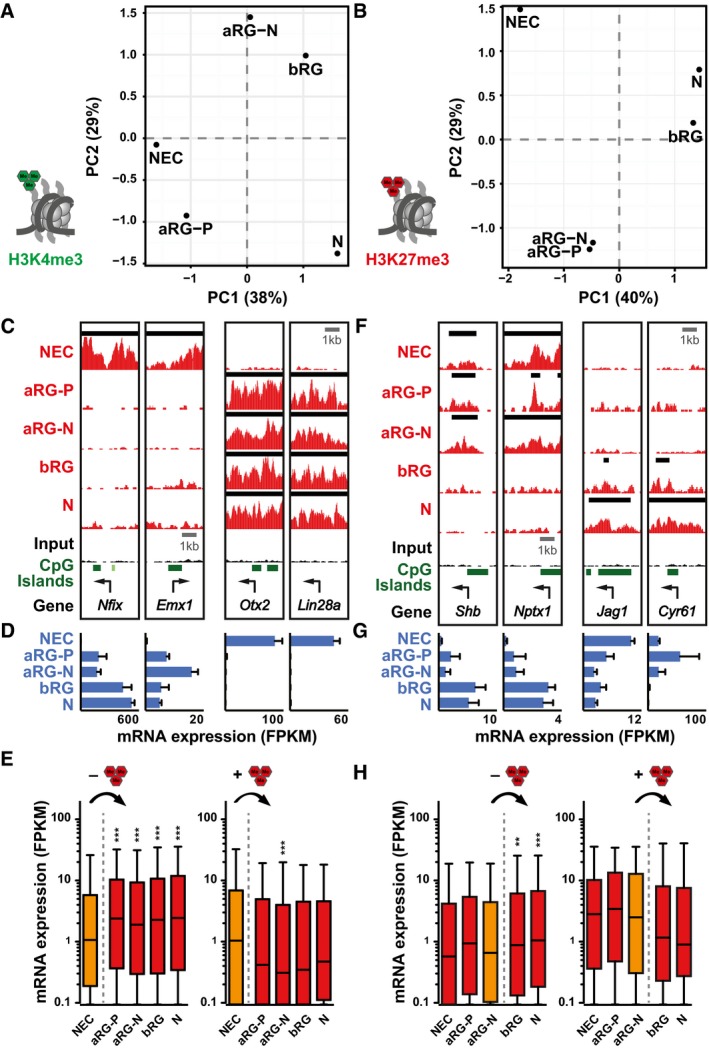
Principal component analysis (PCA) of H3K4me3 (A) and H3K27me3 (B) signals. The percentage of variance covered by the first two components is indicated.
- C
Example ChIP‐seq tracks for genes that loose (left) or gain (right) H3K27me3 from E9.5 NECs to E14.5 aRG‐P. Black lines above each track indicate peaks (called with MACS2). Arrows indicate TSS.
- D
mRNA expression for genes shown in (C), analyzed by RNA‐seq.
- E
mRNA expression (in FPKM) of genes that loose (left, n = 2,857) or gain (right, n = 714) H3K27me3 from E9.5 NECs to E14.5 aRG‐P, shown as box plots.
- F
Example ChIP‐seq tracks for genes that loose (left) or gain (right) H3K27me3 from aRG‐N to bRG.
- G
mRNA expression for genes shown in (F), analyzed by RNA‐seq.
- H
mRNA expression (in FPKM) of genes that loose (left, n = 2,051) or gain (right, n = 197) H3K27me3 from aRG‐N to bRG, shown as box plots.
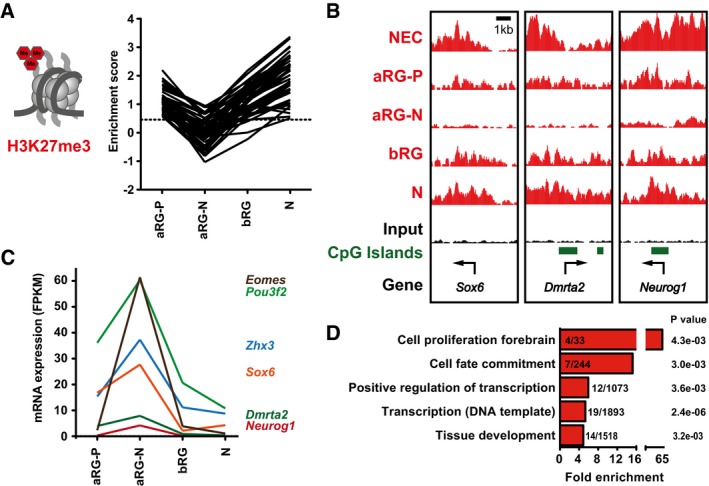
Line plot depicting H3K27me3 enrichment scores of genes with transient dynamic changes in H3K27me3 in the neural cell populations isolated at E14.5 (n = 50 genes).
Example ChIP‐seq tracks for genes with dynamic changes in H3K27me3 in E14.5 neural cell populations. Arrows indicate TSS.
mRNA expression (in FPKM) of genes with dynamic changes in H3K27me3 in E14.5 neural cell populations and significant changes in gene expression (n = 6 genes) between aRG‐P and aRG‐N, shown as line plots. The differential gene expression analysis was performed with cufflinks (v2.2.1) using 0.01 as P‐value cutoff.
GO term enrichment analysis of genes with dynamic changes in H3K27me3 in E14.5 neural cell populations. The five GO term clusters with the lowest P‐value are shown (category: biological process).
- A
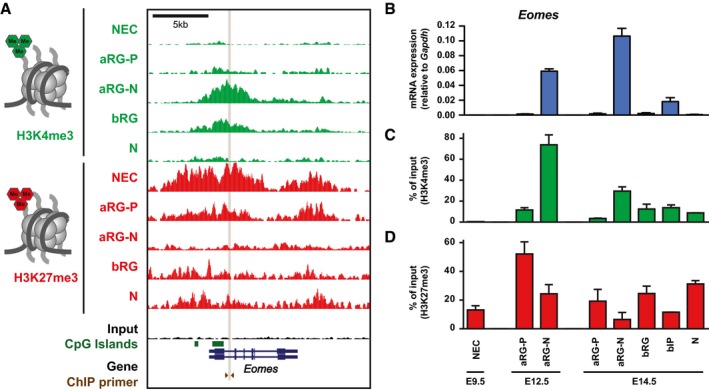
H3K4me3 (green) and H3K27me3 (red) ChIP‐seq tracks at the mouse Eomes locus in the defined neural cell populations. Note that a larger region showing the entire Eomes locus is shown, compared to the TSS in Fig 1B.
- B
Time course of Eomes mRNA expression in the defined neural cell populations at E9.5, E12.5, and E14.5, as determined by RT–qPCR.
- C, D
Time course of the level of H3K4me3 (C) and H3K27me3 (D) at the Eomes locus as determined by ChIP‐qPCR in the defined neural cell populations at E9.5, E12.5, and E14.5. The amount of DNA obtained after ChIP‐qPCR using control IgG was < 0.5% of the input DNA for all cell populations. The location of the primers used for ChIP‐qPCR is indicated in (A).
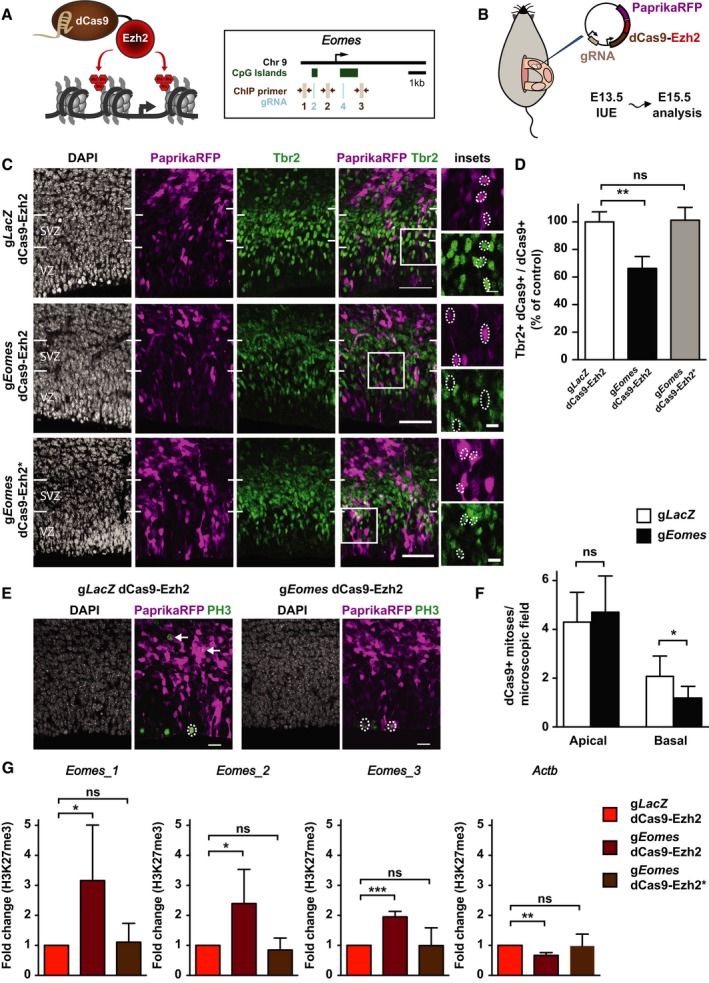
Schematic overview of the CRISPR/Cas9‐based deposition of H3K27me3 at the Eomes locus. The localization of gRNAs (light blue) and ChIP‐qPCR primers (brown) is indicated.
Schematic overview (adapted from Kalebic et al, 2016) of the IUE experiments using dCas9‐Ezh2.
Mouse E13.5 dorsolateral telencephalon was in utero electroporated with a plasmid encoding PaprikaRFP and either gLacZ dCas9‐Ezh2 (control, top row), gEomes dCas9‐Ezh2 (middle row), or gEomes dCas9‐Ezh2* mutant (bottom row), followed by analysis at E15.5 of PaprikaRFP fluorescence (magenta) and Tbr2 immunofluorescence (green) combined with DAPI staining (white). Images represent single optical sections. White boxes indicate areas shown at higher magnification in the insets. Dotted ellipses indicate examples of nuclei of PaprikaRFP‐positive cells. Note the presence of Tbr2 immunoreactivity in the gLacZ dCas9‐Ezh2 control and gEomes dCas9‐Ezh2* mutant condition and its reduction upon gEomes dCas9‐Ezh2 IUE. Scale bars, 50 μm and 10 μm (insets).
Quantification of the percentage of dCas9‐positive cells that are Tbr2‐positive 48 h after gLacZ dCas9‐Ezh2 (white, n = 7 IUE experiments), gEomes dCas9‐Ezh2 (black, n = 5), or gEomes dCas9‐Ezh2* mutant (gray, n = 4) IUE. The average of all control samples was set to 100%. Data represent mean ± SD. **P < 0.005 (Mann–Whitney U‐test); ns, not significant.
Analysis of PaprikaRFP fluorescence (magenta) and PH3 immunofluorescence (green) combined with DAPI staining (white) following IUE. Dotted ellipses indicate examples of apical, and arrows of basal, mitotic targeted cells. Images represent single optical sections. Scale bars, 20 μm.
Quantification of apical and basal dCas9‐positive mitoses 48 h after gLacZ (white) and gEomes (black) dCas9‐Ezh2 IUE. Data represent mean ± SD (n = 9 IUE experiments). *P < 0.05 (Student's t‐test); ns, not significant.
ChIP‐qPCR analysis of H3K27me3 levels around the TSS of Eomes and an unrelated gene (Actb) after IUE. Electroporated (PaprikaRFP+) neurogenic (Tis21‐GFP+) NPCs were isolated by FACS. Error bars represent SD of biological replicates (n = 4 IUE experiments). Fold changes are relative to respective control. Significance was calculated using a one‐sample t‐test on log‐transformed fold change values (see Appendix Fig S10F). *P < 0.05; **P < 0.01; ***P < 0.001; ns, not significant.
References
-
- Aprea J, Prenninger S, Dori M, Ghosh T, Monasor LS, Wessendorf E, Zocher S, Massalini S, Alexopoulou D, Lesche M, Dahl A, Groszer M, Hiller M, Calegari F (2013) Transcriptome sequencing during mouse brain development identifies long non‐coding RNAs functionally involved in neurogenic commitment. EMBO J 32: 3145–3160 - PMC - PubMed
-
- Arcila ML, Betizeau M, Cambronne XA, Guzman E, Doerflinger N, Bouhallier F, Zhou H, Wu B, Rani N, Bassett DS, Borello U, Huissoud C, Goodman RH, Dehay C, Kosik KS (2014) Novel primate miRNAs coevolved with ancient target genes in germinal zone‐specific expression patterns. Neuron 81: 1255–1262 - PMC - PubMed
Publication types
MeSH terms
Substances
LinkOut - more resources
Full Text Sources
Other Literature Sources
Molecular Biology Databases
