. 2017 Aug 1;144(15):2748-2763.
doi: 10.1242/dev.146811.

Epigenetic resetting of human pluripotency

Affiliations

Epigenetic resetting of human pluripotency

Ge Guo et al. Development. .

Erratum in

Abstract

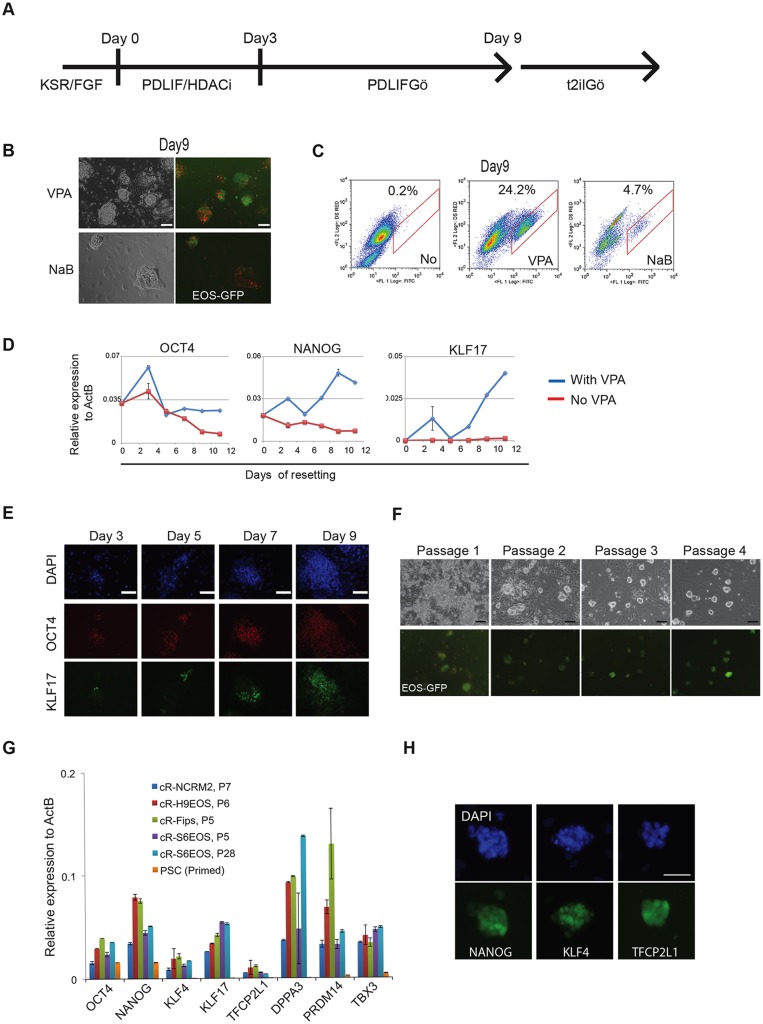
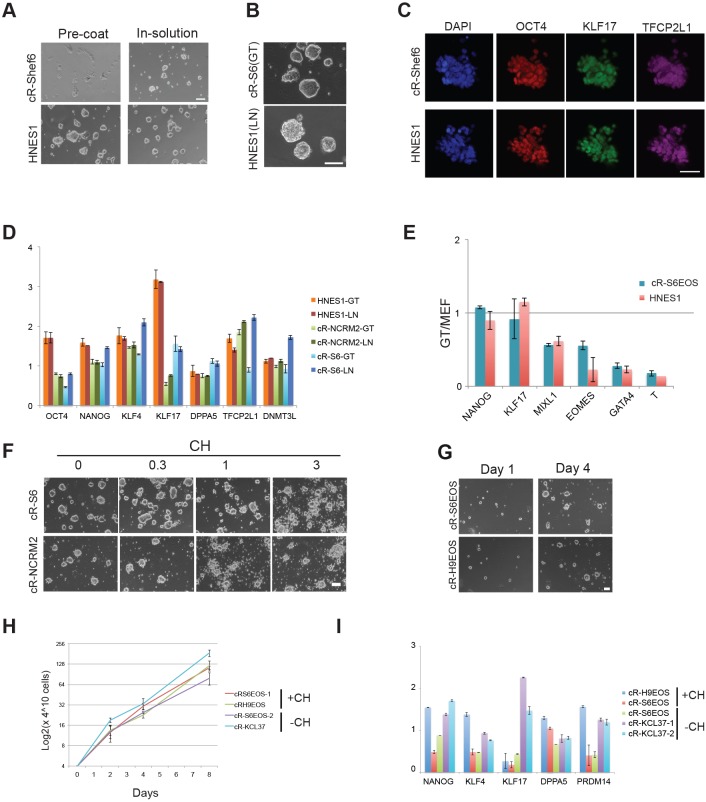
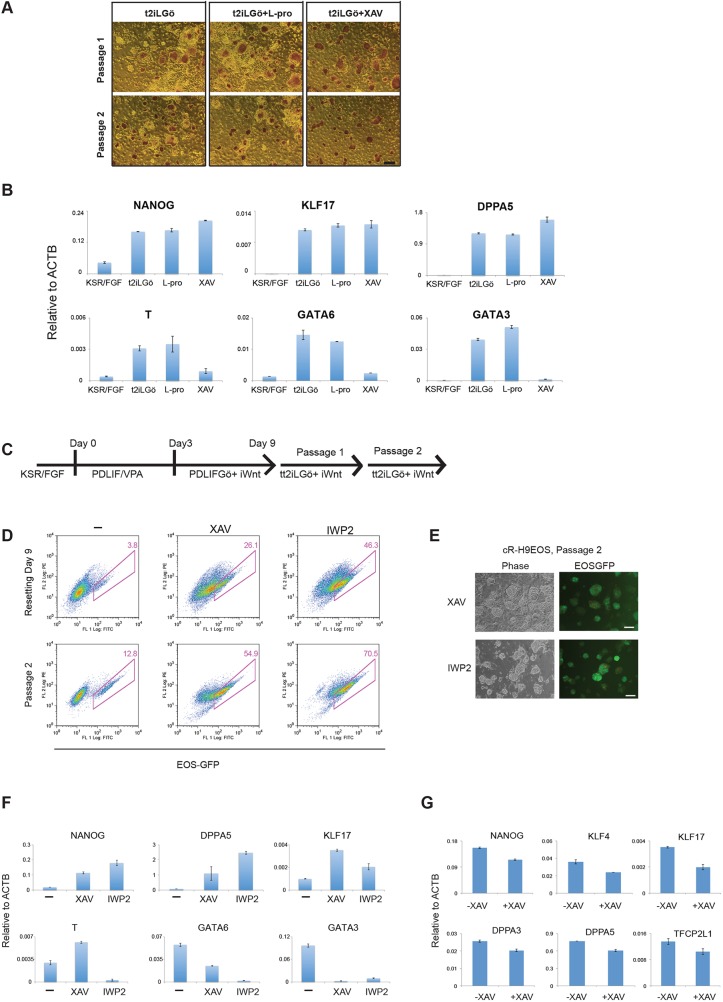
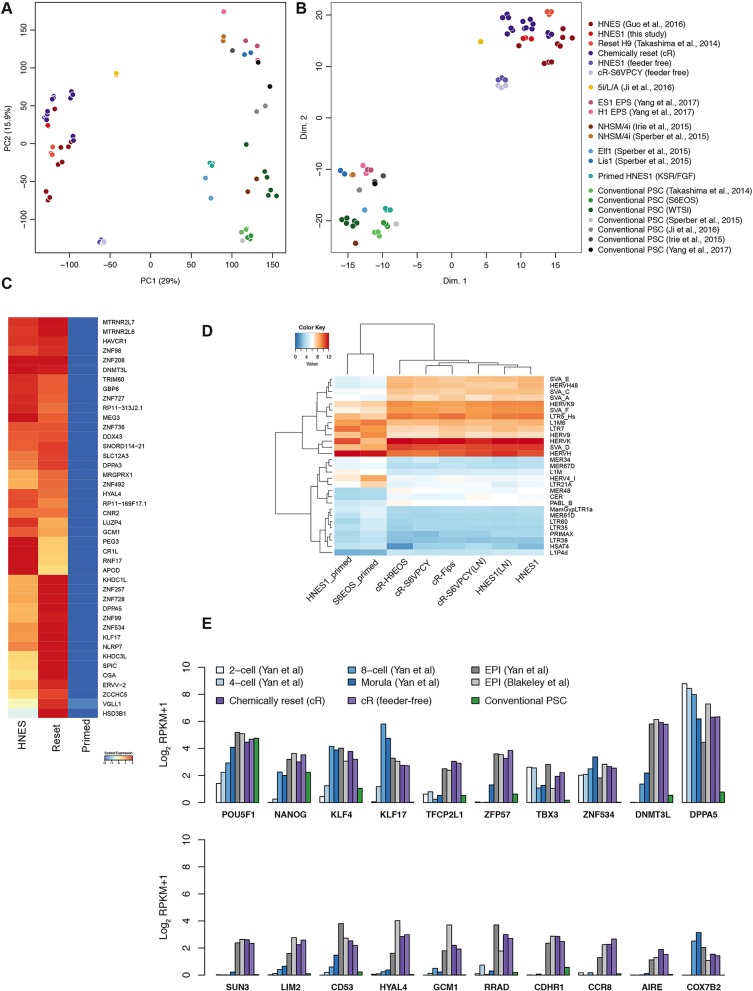
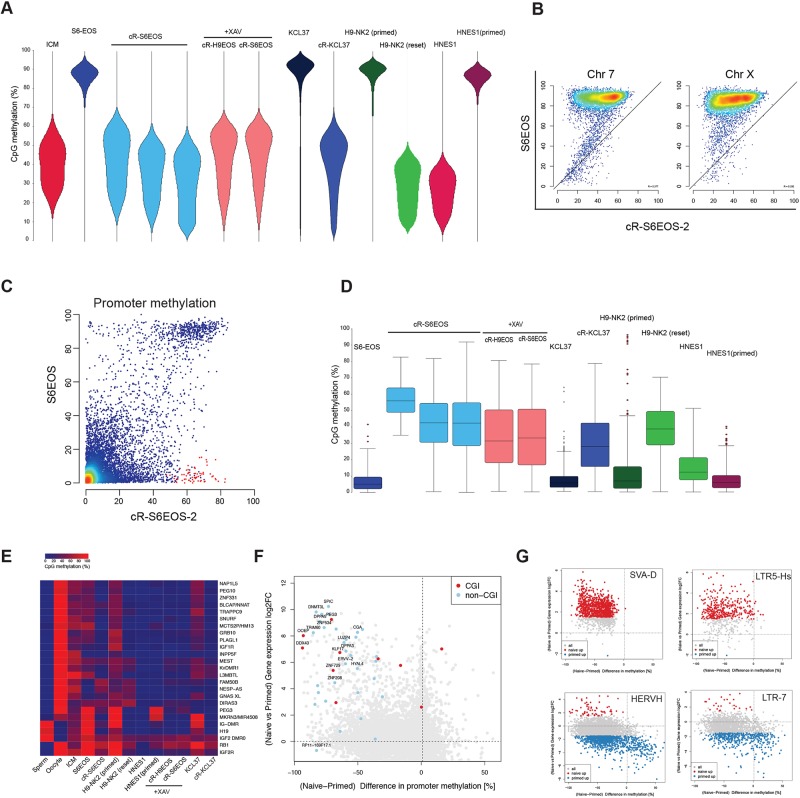
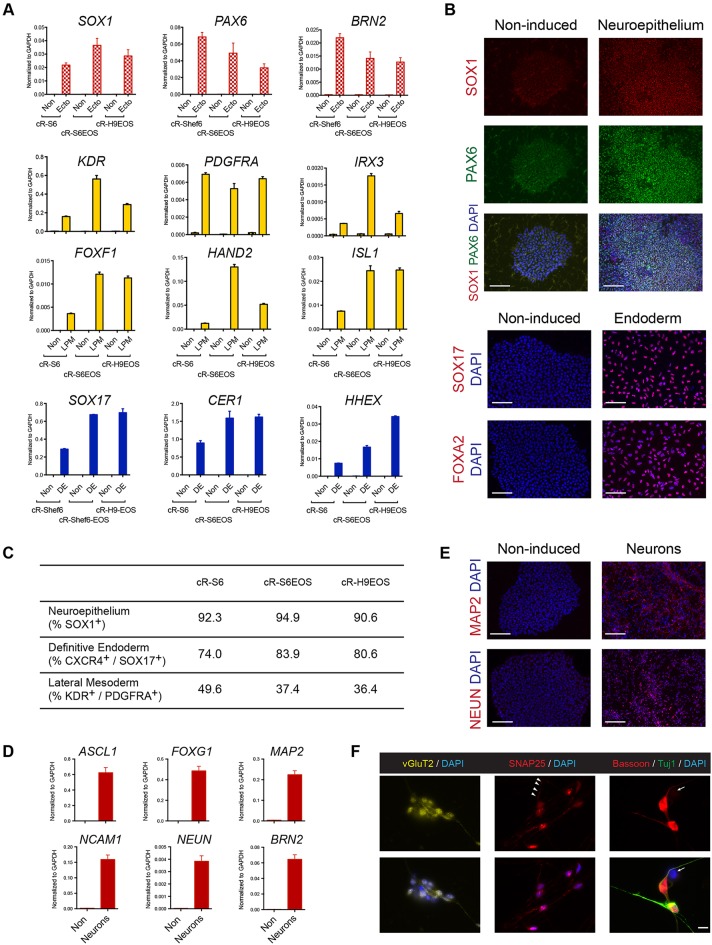
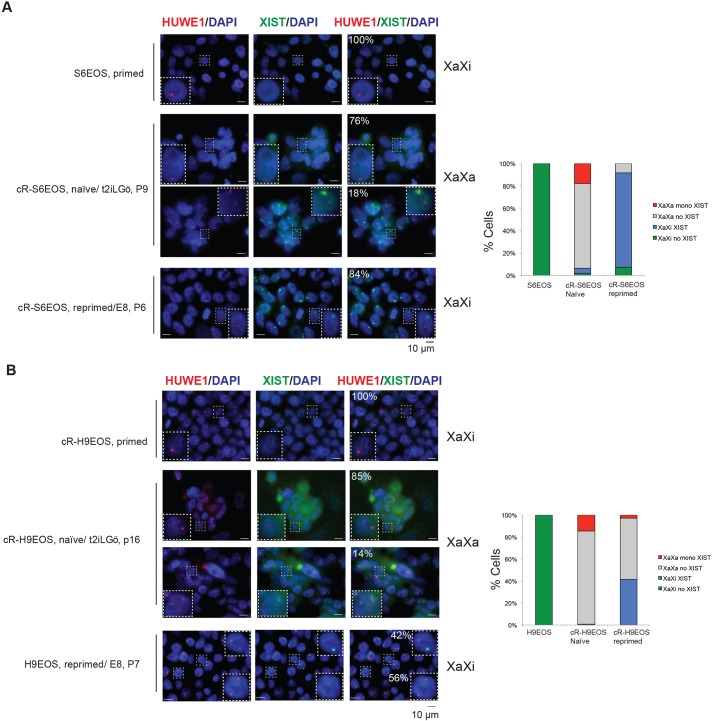
Much attention has focussed on the conversion of human pluripotent stem cells (PSCs) to a more naïve developmental status. Here we provide a method for resetting via transient histone deacetylase inhibition. The protocol is effective across multiple PSC lines and can proceed without karyotype change. Reset cells can be expanded without feeders with a doubling time of around 24 h. WNT inhibition stabilises the resetting process. The transcriptome of reset cells diverges markedly from that of primed PSCs and shares features with human inner cell mass (ICM). Reset cells activate expression of primate-specific transposable elements. DNA methylation is globally reduced to a level equivalent to that in the ICM and is non-random, with gain of methylation at specific loci. Methylation imprints are mostly lost, however. Reset cells can be re-primed to undergo tri-lineage differentiation and germline specification. In female reset cells, appearance of biallelic X-linked gene transcription indicates reactivation of the silenced X chromosome. On reconversion to primed status, XIST-induced silencing restores monoallelic gene expression. The facile and robust conversion routine with accompanying data resources will enable widespread utilisation, interrogation, and refinement of candidate naïve cells.

Keywords: Differentiation; Human embryo; Methylome; Pluripotent stem cells; Reprogramming.


Conflict of interest statement

Competing interestsG.G. and A.Sm. are inventors on a patent filing by the University of Cambridge relating to human naïve pluripotent stem cells. W.R. is a consultant to, and shareholder in, Cambridge Epigenetix.

Figures

Fig. 1.
Fig. 1.
Resetting human pluripotent stem cells (hPSCs) with HDAC inhibitors. (A) Schematic of the chemical resetting protocol. HDACi, HDAC inhibitor. (B) Images of reset S6EOS cells at day 9 in t2iLGö. Red staining is from Gö6983. VPA, valproic acid; NaB, sodium butyrate. (C) Flow cytometry analysis of EOS-GFP expression at day 9 of resetting. (D) RT-qPCR analysis of pluripotency markers in S6EOS cells subjected to the resetting culture regime with or without VPA. Error bars indicate s.d. of technical duplicates. (E) Immunostaining for OCT4 and KLF17 during resetting of Shef6 cells. (F) Images of reset S6EOS cultures over the first four passages. (G) RT-qPCR analysis of general and naïve pluripotency markers in various reset cell cultures. Error bars indicate s.d. of technical duplicates. (H) Immunostaining of pluripotency markers in established reset culture, cR-H9EOS. Scale bars: 100 μm.
Fig. 2.
Fig. 2.
Feeder-free culture. (A) Cells plated on Geltrex-coated plates (left) or with Geltrex added to the medium (right). Images taken after 4 days. (B) Cultures in Geltrex (GT) or laminin (LN) for more than ten passages. (C) Immunostaining for pluripotency markers in reset cells passaged in laminin. (D) Naïve marker expression in feeder-free reset cultures in t2iLGö as determined by RT-qPCR and normalised to the expression level in H9-NK2 transgene reset cells. (E) Lineage marker expression in feeder-free reset cultures relative to levels on feeders. (F) Reset cells plated in the presence of the indicated concentrations (µM) of the GSK3 inhibitor CHIR99021 (CH) for 4 days. (G) Images of colony expansion over 4 days in Geltrex. (H) Growth curve for reset cells in tt2ilGö and Geltrex. Error bars indicate s.d. from triplicate cultures. (I) RT-qPCR marker profile for cells reset with or without CH and expanded in tt2iLGö and Geltrex, normalized to expression level in cR-H9 cells on MEF in tt2iLGö. Error bars on PCR plots indicate s.d. of technical duplicates. Scale bars: 100 μm in A,B,F,G; 50 μm in C.
Fig. 3.
Fig. 3.
WNT inhibition stabilises resetting. (A) Alkaline phosphatase staining of H9-NK2 colonies at first and second passage after DOX withdrawal and transfer into t2iLGö alone or plus L-proline (L-Pro) or the tankyrase inhibitor XAV939 (XAV). (B) RT-qPCR analysis of marker expression in H9-NK2 cells at passage 2, treated as in A. KSR/FGF reference sample is a conventional S6EOS culture. (C) Resetting protocol with WNT inhibitors. (D) (Top) Flow analysis of resetting H9EOS cells cultured in the presence or absence of WNT inhibitors. (Bottom) Flow analysis after two passages (a further 8 days) in tt2iLGö with WNT inhibitors on MEFs. (E) cR-H9EOS colonies in tt2iLGö with XAV or the WNT pathway inhibitor IWP2 after two passages on MEFs. (F) Marker analysis by RT-qPCR for cR-H9EOS cells at passage 2 cultured in tt2iLGö with and without WNT inhibitors. (G) Marker analysis by RT-qPCR of cR-H9EOS cultures generated with or without XAV and transferred into tt2iLGö on Geltrex (without XAV) for four passages. Error bars on PCR plots indicate s.d. of technical duplicates. Scale bars: 200 μm in A; 100 μm in E.
Fig. 4.
Fig. 4.
Transcriptome analysis of reset PSCs. (A) Principal component analysis (PCA) of whole-transcriptome RNA-seq data from the indicated cell lines. (B) t-SNE analysis of RNA-seq data. (C) Heatmap of differentially expressed genes between chemically reset (cR) and embryo-derived HNES cells (naïve) compared with conventional hPSCs (primed). Genes unregulated in naïve cells are shown, ranked by log2 fold-change (FC). Values displayed correspond to the average expression level in each sample group scaled by the mean expression of each gene. (D) Heatmap showing expression of all transposon families that are differentially expressed (log2 FC>1.5, P<0.05). (E) Comparative expression of pluripotency markers in human embryo cells (Blakeley et al., 2015; Yan et al., 2013), HNES cells, cR cells, conventional primed PSCs, NHSM cultures and purported expanded potency (EPS) cells. Data shown reflect mean expression levels from cell lines and biological replicates belonging to each sample group, and single cells from indicated embryo stages. Published datasets used are identified in the Materials and Methods.
Fig. 5.
Fig. 5.
Methylome analysis of reset PSCs. (A) Bean plots showing the global distribution of CpG methylation levels from pooled replicates of the indicated samples compared with human ICM data (Guo, 2014). Reset samples are from independent derivations without or with addition of XAV. Methylation was quantitated over 20 kb genomic tiles. Note that KCL37 and HNES1 are male and H9 and Shef6 are female. (B) Scatter plots of CpG methylation percentages over tiles spanning 20 kb on chromosome 7 and chromosome X, comparing parental Shef6EOS (in KSR/FGF) with cR-S6EOS. (C) Scatter plots of CpG methylation over promoters (−900 to +100), for parental and cR-S6EOS cells. Promoters with >40% gain in CpG methylation in reset cells are highlighted in red. (D) CpG methylation levels of a subset of promoters highlighted (red) in C in the indicated samples. (E) Averaged CpG methylation of known DMRs of imprinted maternal and paternal genes. Sperm and oocyte data are from Okae et al. (2014); ICM from Guo et al. (2014); H9 and H9-NK2 from Takashima et al. (2014). (F) Scatter plot showing the change in expression (log2 FC) against the difference in promoter methylation for reset (averaged over cR-H9EOS and cR-S6EOS) versus parental Shef6EOS. (G) Scatter plots for prominent differentially expressed transposon families showing the change in expression (log2 FC) versus the difference in methylation for all loci.
Fig. 6.
Fig. 6.
Differentiation of reset PSCs. (A) RT-qPCR analysis of lineage specification markers after induction of re-primed cR lines. ‘Non' indicates non-induced; Ecto, neuroectoderm; DE, definitive endoderm; LPM, lateral plate mesoderm. (B) Immunostaining for lineage specification markers. (C) Summary of flow cytometric quantification of neuroectodermal, mesodermal and endodermal lineage specification. (D) RT-qPCR assays for pan-neuronal markers after 29 days differentiation from re-primed cR-S6EOS cells. (E) Immunostaining for neuronal markers MAP2 and NEUN after 29 days. (F) Immunostaining for neuronal maturation markers after 40 days. Arrowheads (middle) highlight expected punctate clusters of SNAP25; arrows (right) indicate a non-stained cell to show antibody specificity. Error bars in PCR plots are s.d. of technical duplicates. Scale bars: 100 μm in B,E; 10 μm in F.
Fig. 7.
Fig. 7.
X-chromosome status of parental, reset and re-primed cells. (A) S6EOS. (B) H9EOS. Images show RNA FISH for nascent X-linked RNA transcription. Note that in re-primed cells displaying monoallelic HUWE1 and XIST expression, the two signals are on different chromosomes. Bar charts show quantification of X-chromosome activation status based on HUWE1 and XIST signals from samples of at least 100 cells.

References

    1. Aken B. L., Ayling S., Barrell D., Clarke L., Curwen V., Fairley S., Fernandez Banet J., Billis K., Garcia Giron C., Hourlier T. et al. (2016). The Ensembl gene annotation system. Database (Oxford) 2016. 10.1093/database/baw093 - DOI - PMC - PubMed
    1. Amps K., Andrews P. W., Anyfantis G., Armstrong L., Avery S., Baharvand H., Baker J., Baker D., Munoz M. B., Beil S. et al. (2011). Screening ethnically diverse human embryonic stem cells identifies a chromosome 20 minimal amplicon conferring growth advantage. Nat. Biotechnol. 29, 1132-1144. 10.1038/nbt.1974 - DOI - PMC - PubMed
    1. Anders S. and Huber W. (2010). Differential expression analysis for sequence count data. Genome Biol. 11, R106 10.1186/gb-2010-11-10-r106 - DOI - PMC - PubMed
    1. Anders S., Pyl P. T. and Huber W. (2014). HTSeq – A Python framework to work with high-throughput sequencing data. bioRxiv. 10.1101/002824 - DOI - PMC - PubMed
    1. Blakeley P., Fogarty N. M. E., del Valle I., Wamaitha S. E., Hu T. X., Elder K., Snell P., Christie L., Robson P. and Niakan K. K. (2015). Defining the three cell lineages of the human blastocyst by single-cell RNA-seq. Development 142, 3151-3165. 10.1242/dev.123547 - DOI - PMC - PubMed

Publication types

MeSH terms

Substances