. 2017 Sep 4;214(9):2591-2610.
doi: 10.1084/jem.20161134. Epub 2017 Aug 1.

Induction of IAPP amyloid deposition and associated diabetic abnormalities by a prion-like mechanism

Affiliations

Induction of IAPP amyloid deposition and associated diabetic abnormalities by a prion-like mechanism

Abhisek Mukherjee et al. J Exp Med. .

Abstract

Although a large proportion of patients with type 2 diabetes (T2D) accumulate misfolded aggregates composed of the islet amyloid polypeptide (IAPP), its role in the disease is unknown. Here, we show that pancreatic IAPP aggregates can promote the misfolding and aggregation of endogenous IAPP in islet cultures obtained from transgenic mouse or healthy human pancreas. Islet homogenates immunodepleted with anti-IAPP-specific antibodies were not able to induce IAPP aggregation. Importantly, intraperitoneal inoculation of pancreatic homogenates containing IAPP aggregates into transgenic mice expressing human IAPP dramatically accelerates IAPP amyloid deposition, which was accompanied by clinical abnormalities typical of T2D, including hyperglycemia, impaired glucose tolerance, and a substantial reduction on β cell number and mass. Finally, induction of IAPP deposition and diabetic abnormalities were also induced in vivo by administration of IAPP aggregates prepared in vitro using pure, synthetic IAPP. Our findings suggest that some of the pathologic and clinical alterations of T2D might be transmissible through a similar mechanism by which prions propagate in prion diseases.


Figures

Figure 1.
Figure 1.
Characterization of the pancreas tissue used as inoculum in our studies. Pancreas from a 12-mo-old, male, Tg-hIAPP mouse exhibiting overt signs of diabetes (blood glucose >360 mg/dl) as well as an age-matched WT mice used as control were extracted and analyzed histologically by immunohistochemistry using anti-IAPP and anti-insulin antibodies and ThS staining. Images display staining of representative sections.
Figure 2.
Figure 2.
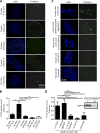
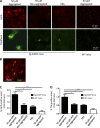
Islet homogenate from aged Tg-hIAPP mice induces IAPP deposition in isolated islet cultures from either Tg mice or healthy humans. (A) Isolated islets from 3-wk-old, female, Tg-hIAPP mice were cultured in presence of different concentrations of islet extracts (IE) from old Tg-hIAPP mice, with overt diabetic pathology and age-matched WT mice. Representative images of islets, after diverse treatments, characterized by DAPI staining (blue) and by presence of amyloid by ThS amyloid staining (green). (B) The amyloid load present in the islets was quantified by measuring ThS-positive area/total islet area. The values correspond to means ± SE of 5–20 islets analyzed per condition. Data were analyzed by one-way ANOVA, and differences were highly significant (P < 0.0001). Individual differences were evaluated by Tukey’s multiple comparison posttest (***, P < 0.001). (C) Human islets, isolated postmortem from nondiabetic individuals, were treated with 1% islet homogenate from old Tg-hIAPP mice, WT control islet homogenates, or old Tg-hIAPP immunodepleted using a cocktail of sequence and conformational antibodies. In addition, human islets were incubated with 100 nM synthetic IAPP aggregates using the conditions described in Fig. 5. After 10 d, islets were fixed and stained with DAPI (blue) and ThS (green). Representative pictures from each condition. (D) The amyloid present in islets was quantified by measuring the percentage of ThS-positive area/total islet area. On average, 27 islets were analyzed per condition, and data correspond to mean ± SE. (Inset) Amount of IAPP signal present in the extracts of islet homogenates before and after immunodepletion, as measured by Western blot. Data were analyzed by Kruskal–Wallis test, and treatment differences were highly significant (P < 0.0001). Individual differences were evaluated by Dunn’s multiple comparison test. **, P < 0.01; ***, P < 0.001.
Figure 3.
Figure 3.
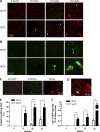
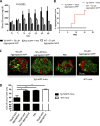
Inoculation with old Tg-hIAPP pancreas homogenate accelerates IAPP misfolding and aggregation. (See also Figs. S1 and S2.) Groups of male Tg-hIAPP mice were injected i.p. at 3 wk of age with 10% pancreas homogenate from either 12-mo-old, male, IAPP Tg mice bearing substantial islet amyloid aggregates (as shown in Fig. 1) or from age-matched, male, WT mice not expressing hIAPP. Groups of three to sixmice were sacrificed 2, 5, 7, and 17 wk after inoculation, when they reached 5, 8, 10, and 20 wk of age, respectively. Appearance of IAPP aggregates was assessed by histologic studies using anti-IAPP antibody (A) or the amyloid-binding dye ThS (B). (A and B) Figures correspond to representative pictures of the five animals studied, except in the case of the animals treated with WT pancreas homogenate and sacrificed at 10 wk old; in which, 2 animals died of unrelated reasons. Arrows highlight small punctate deposits. (C) Slides were stained simultaneously with anti-IAPP antibody and ThS and colocalization of the staining analyzed. The picture corresponds to an animal of the Tg-hIAPP inoculated group sacrificed at 10 wk old. Arrows in the merged image point to the deposits in which colocalization was observed. (D) Double-staining with ThS (green) and anti-insulin antibody (red). The picture corresponds to a representative image of one animal treated with Tg-hIAPP pancreas homogenate and sacrificed at 20 wk old. Image analysis of the immunohistochemical studies displayed in A (staining with an anti-IAPP antibody) was performed to estimate the percentage of islets containing amyloid deposits (E) and the load of IAPP aggregates (F), calculated as the percentage of the stained area compared with the total islet area. The values correspond to the mean ± SE of the results obtained for the three to six animals used per each group. (E and F) Black bars represent the animals inoculated with old Tg-hIAPP pancreas homogenate, and white bars correspond to the controls injected with WT pancreas. The data were statistically analyzed by two-way ANOVA using age and source of inoculation as the variables. In both cases, the overall results were statistically significant (P < 0.001). Individual differences between Tg/Tg and Tg/WT animals were studied by the Bonferroni posttest. *, P < 0.05; **, P < 0.01; ***, P < 0.001.
Figure 4.
Figure 4.
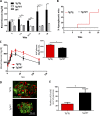
Inoculation with old Tg-hIAPP pancreas homogenate induces clinical abnormalities typical of T2D. (See also Figs. S1 and S2.) (A) Hyperglycemia was measured over time by the fasting blood glucose concentration. The values correspond to the mean ± SE of the results obtained from five to seven animals in each group. Black bars represent the Tg-hIAPP mice inoculated with old Tg-hIAPP pancreas homogenate, and white bars the controls injected with WT pancreas homogenate. For comparison, the blood glycemia of WT, untreated animals is shown (gray bars). The data were statistically analyzed by two-way ANOVA using age and source of inoculation as the variables. The analysis shows that the increase in glucose concentration in the Tg/Tg group was highly significant (P < 0.001). Individual differences between groups on different days were analyzed by one-way ANOVA followed by the Tukey’s multiple comparison posttest. *, P < 0.05; **, P < 0.01; ***, P < 0.001. (B) Inoculation with diabetic pancreas homogenate produced severe hyperglycemia (>250 mg/dL) in a portion of the animals. The percentage of hyperglycemic animals increased progressively with time after inoculation of Tg pancreas extracts, whereas up to 20 wk of age, no animals of the Tg/WT group reached the threshold to be considered hyperglycemic. The differences were statistically significant (P = 0.02) as analyzed by the log-rank (Mantel–Cox) test. (C) To evaluate impairment in glucose tolerance, the i.p. glucose tolerance test was performed in 16-wk-old, Tg-hIAPP mice inoculated with pancreas extracts from old Tg-hIAPP (red line) as compared with Tg-hIAPP mice inoculated with PBS (black line). The graph shows plasma glucose concentrations during the test after 16 h fasting. Area under the curve (AUC) was calculated using the trapezoidal rule (inset), and the values corresponds to means ± SE from five animals/group. The data were statistically analyzed by unpaired two-tailed t test (P = 0.0373). (D) The morphology of islets and the presence of different cell types was measured in different groups of mice at 20 wk old by staining with anti-insulin (green) to detect β cells, anti-glucagon, and anti-somatostatin antibodies (combined, red) to detect α- and δ-cells, respectively. The figure shows representative images of the islets from the Tg/Tg and Tg/WT mice. Image analysis of stained islets enabled us to calculate the number of β cells/mm2 of pancreas area (E). Data correspond to the mean ± SE, and results were analyzed by unpaired two-tailed t test (*, P = 0.0234).
Figure 5.
Figure 5.
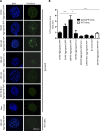
Induction of IAPP amyloid deposition in islets by incubation with synthetic IAPP aggregates. (See also Figs. S3 and S4.) (A) Isolated islets from 3-wk-old, female, Tg-hIAPP mice were cultured in presence of different concentrations of IAPP aggregates prepared in vitro from synthetic IAPP, as well as controls treated with other amyloidogenic proteins, including the Alzheimer's disease–associated protein Tau (the K18 fragment) and the bacterial amyloid Mcc. Representative images of islets after diverse treatments, characterized by DAPI staining (blue) and the presence of amyloid by ThS amyloid staining (green). (B) The amyloid load present in the islets was quantified by measuring ThS-positive area/total islet area. The values correspond to means ± SE of 4–27 islets analyzed per condition. Data were analyzed by one-way ANOVA, and differences were highly significant (P < 0.0001). Individual differences among the different groups were studied by the Tukey’s multiple comparison test. *, P < 0.05; ***, P < 0.001.
Figure 6.
Figure 6.
In vivo induction of IAPP deposition by synthetic IAPP aggregates. (See also Fig. S3.) (A) Groups of male, Tg-hIAPP mice were injected i.p. at 3 wk old with 50 µM of in vitro, prepared, synthetic IAPP aggregates or the same concentration of nonaggregated protein. Animals were sacrificed at 16 wk old, and appearance of IAPP aggregates was assessed by histologic studies using anti-IAPP antibody or the amyloid-binding dye ThS. The figures included correspond to representative pictures of the animals studied. As controls, WT mice were injected with the same preparation of synthetic IAPP aggregates. (B) Double-staining of ThS (green) and insulin (red). The picture corresponds to a representative image from one animal of the group treated with 50 µM of IAPP aggregates. The accumulation of aggregates was quantified by the area of the islets occupied by anti-IAPP antibody reactive (C) and ThS-positive (D) deposits. (C and D) Bars correspond to mean ± SE, and data were analyzed by one-way ANOVA, and in both cases, the differences were highly significant (P < 0.001). Individual differences among the groups were studied by the Tukey’s multiple comparison posttest. *, P < 0.05; ***, P < 0.001.
Figure 7.
Figure 7.
Inoculation with synthetic IAPP aggregates induces clinical abnormalities typical of T2D. (A) The fasting blood glucose concentration was measured over time in Tg-hIAPP or WT mice injected with synthetic IAPP aggregates or PBS. The values correspond to the means ± SE of the results obtained for 5–11 animals per group. Black bars represent the Tg-hIAPP mice inoculated with 50 µM of synthetic IAPP aggregates, and white bars are for the controls injected with PBS. Gray bars correspond to WT mice injected with the same preparation of IAPP aggregates. The data were statistically analyzed by two-way ANOVA using age and source of inoculation as the variables, and the results show a highly significant effect of the treatment (P < 0.001), but no significant effect on the interaction among the variables. (B) A proportion of Tg-hIAPP mice injected with IAPP aggregates developed severe hyperglycemia (>300 mg/dL), whereas none of the Tg mice treated with PBS were hyperglycemic. (C) The morphology and cellular composition of islets were measured in various groups of mice at 16 wk of age by staining with anti-insulin (green) or combined anti-glucagon and anti-somatostatin antibodies (red). Representative images of the islets from Tg-hIAPP mice treated with synthetic IAPP aggregates, the same quantity of nonaggregated protein, or the controls treated with PBS. In addition, WT animals treated with the same preparation of synthetic IAPP aggregates are shown for comparison. Image analysis of stained islets was used to estimate the percentage of the islet area occupied by β cells (D) Data correspond to meand ± SE and were analyzed by one-way ANOVA, and differences were statistically significant (P = 0.0015). Individual differences were studied by the Tukey’s multiple comparison test. *, P < 0.05; **, P < 0.01.
Figure 8.
Figure 8.
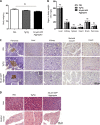
Inoculation with IAPP aggregates does not induce toxicity and IAPP accumulation in major nonpancreatic tissues. Groups of male, IAPP, Tg mice were injected i.p. at 4 wk of age with 10% pancreas homogenate from male, diabetic, IAPP Tg mice or 50 µM IAPP aggregates prepared from synthetic source. As a control, group of IAPP Tg mice were injected with PBS. (A) Body weight of injected animals was measured before sacrificing at 8 wk of age. Analysis by one-way ANOVA showed no significant (P = 0.12) changes in body weight because of injection of IAPP aggregates. (B) Represents the ratio of organ weight/body weight of animals injected with different inocula. The results shows that injection of IAPP aggregate-containing material, compared with PBS, does not induce significant changes in the weight of liver, kidney, spleen, heart, pancreas, and brain. Data for each organ was analyzed by one-way ANOVA, and no significant differences were observed in any of the tissues (P > 0.05). Bars in A and B correspond to mean ± SE. (C) Representative images of sections from different tissues stained with anti-IAPP antibody. The data show no IAPP accumulation in liver, kidney, skeletal muscle, and heart in any of the conditions tested. Sections from pancreas are shown as positive controls. (D) Representative images of sections from liver and skeletal muscle from different experimental groups, stained with hematoxylin and eosin, showing no gross morphological alterations.

Similar articles

Cited by

References

    1. Betsholtz C., Svensson V., Rorsman F., Engström U., Westermark G.T., Wilander E., Johnson K., and Westermark P.. 1989. Islet amyloid polypeptide (IAPP): cDNA cloning and identification of an amyloidogenic region associated with the species-specific occurrence of age-related diabetes mellitus. Exp. Cell Res. 183:484–493. 10.1016/0014-4827(89)90407-2 - DOI - PubMed
    1. Bieler S., Estrada L., Lagos R., Baeza M., Castilla J., and Soto C.. 2005. Amyloid formation modulates the biological activity of a bacterial protein. J. Biol. Chem. 280:26880–26885. 10.1074/jbc.M502031200 - DOI - PubMed
    1. Brissova M., Fowler M.J., Nicholson W.E., Chu A., Hirshberg B., Harlan D.M., and Powers A.C.. 2005. Assessment of human pancreatic islet architecture and composition by laser scanning confocal microscopy. J. Histochem. Cytochem. 53:1087–1097. 10.1369/jhc.5C6684.2005 - DOI - PubMed
    1. Brunham L.R., Kruit J.K., Hayden M.R., and Verchere C.B.. 2010. Cholesterol in β-cell dysfunction: The emerging connection between HDL cholesterol and type 2 diabetes. Curr. Diab. Rep. 10:55–60. 10.1007/s11892-009-0090-x - DOI - PubMed
    1. Butler A.E., Janson J., Bonner-Weir S., Ritzel R., Rizza R.A., and Butler P.C.. 2003. β-Cell deficit and increased β-cell apoptosis in humans with type 2 diabetes. Diabetes. 52:102–110. 10.2337/diabetes.52.1.102 - DOI - PubMed