

Mucosal microbiome dysbiosis in gastric carcinogenesis
- PMID: 28765474
- PMCID: PMC5969346
- DOI: 10.1136/gutjnl-2017-314281
Mucosal microbiome dysbiosis in gastric carcinogenesis
Abstract
Objectives: We aimed to characterise the microbial changes associated with histological stages of gastric tumourigenesis.
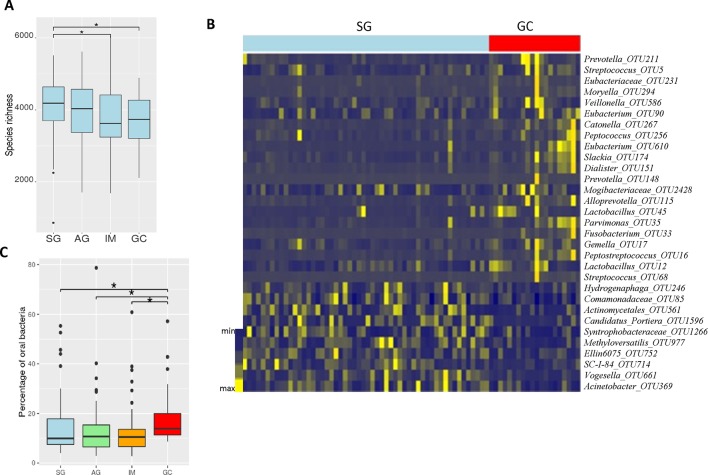
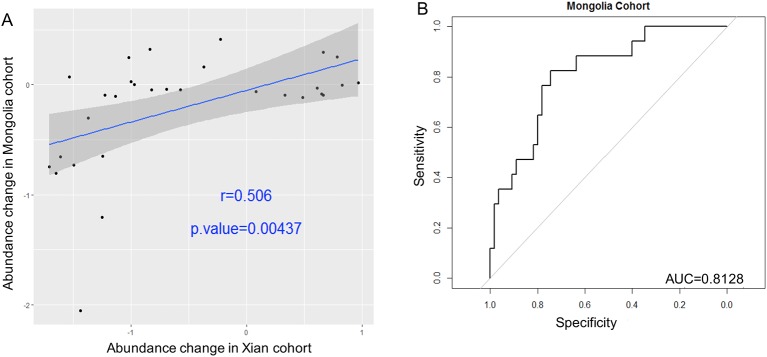
Design: We performed 16S rRNA gene analysis of gastric mucosal samples from 81 cases including superficial gastritis (SG), atrophic gastritis (AG), intestinal metaplasia (IM) and gastric cancer (GC) from Xi'an, China, to determine mucosal microbiome dysbiosis across stages of GC. We validated the results in mucosal samples of 126 cases from Inner Mongolia, China.
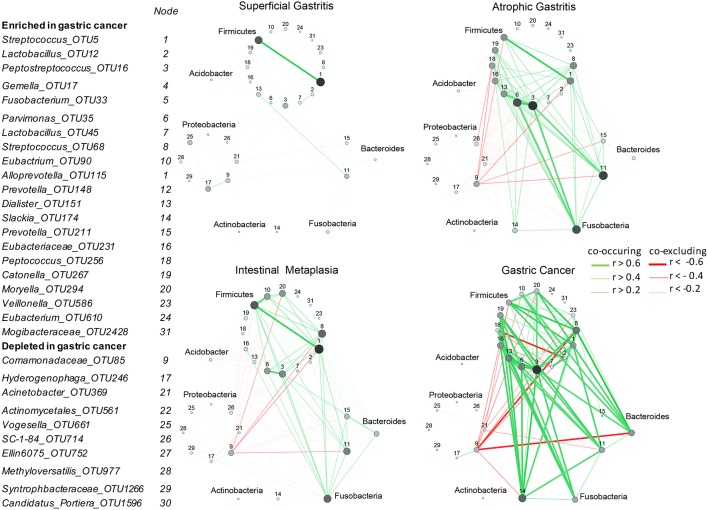
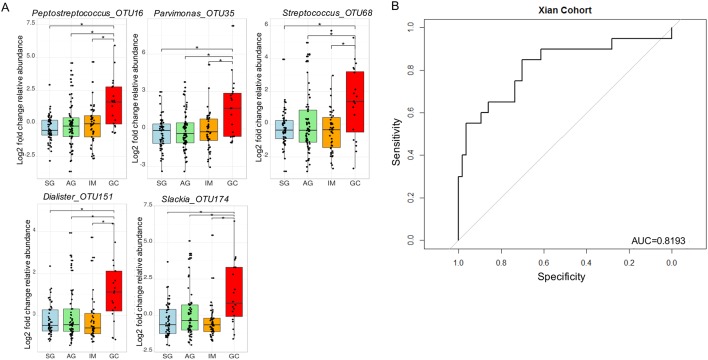
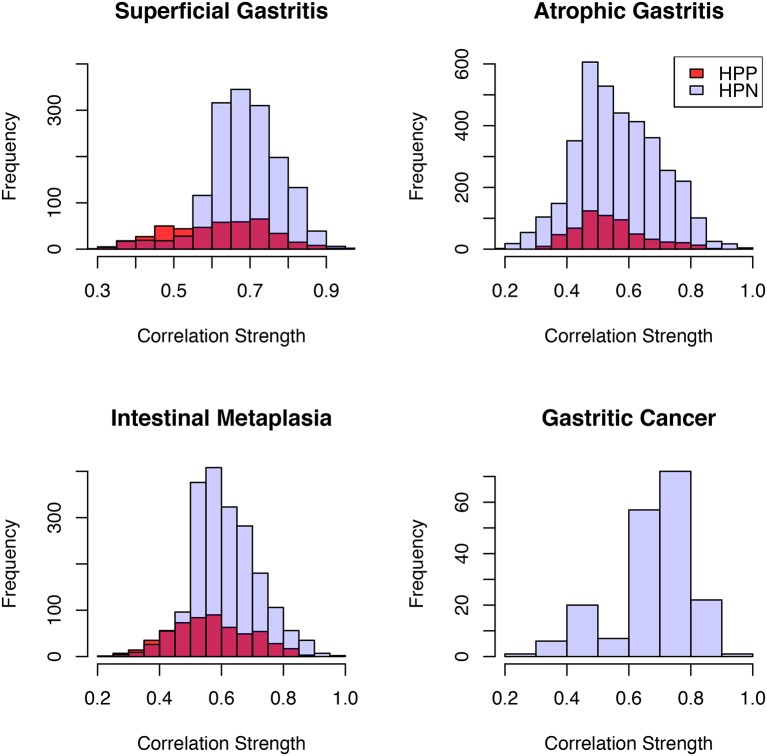
Results: We observed significant mucosa microbial dysbiosis in IM and GC subjects, with significant enrichment of 21 and depletion of 10 bacterial taxa in GC compared with SG (q<0.05). Microbial network analysis showed increasing correlation strengths among them with disease progression (p<0.001). Five GC-enriched bacterial taxa whose species identifications correspond to Peptostreptococcus stomatis, Streptococcus anginosus, Parvimonas micra, Slackia exigua and Dialister pneumosintes had significant centralities in the GC ecological network (p<0.05) and classified GC from SG with an area under the receiver-operating curve (AUC) of 0.82. Moreover, stronger interactions among gastric microbes were observed in Helicobacter pylori-negative samples compared with H. pylori-positive samples in SG and IM. The fold changes of selected bacteria, and strengths of their interactions were successfully validated in the Inner Mongolian cohort, in which the five bacterial markers distinguished GC from SG with an AUC of 0.81.
Conclusions: In addition to microbial compositional changes, we identified differences in bacterial interactions across stages of gastric carcinogenesis. The significant enrichments and network centralities suggest potentially important roles of P. stomatis, D. pneumosintes, S. exigua, P. micra and S. anginosus in GC progression.
Keywords: Gastric cancer; mucosal microbiome dysbiosis; oral bacteria.
© Article author(s) (or their employer(s) unless otherwise stated in the text of the article) 2018. All rights reserved. No commercial use is permitted unless otherwise expressly granted.
Conflict of interest statement
Competing interests: None declared.
Figures
Comment in
-
Gastric cancer: The gastric microbiota - bacterial diversity and implications.Nat Rev Gastroenterol Hepatol. 2017 Dec;14(12):692-693. doi: 10.1038/nrgastro.2017.140. Epub 2017 Oct 18. Nat Rev Gastroenterol Hepatol. 2017. PMID: 29042691 No abstract available.
-
Periodontal disease, tooth loss, and risk of oesophageal and gastric adenocarcinoma: a prospective study.Gut. 2021 Mar;70(3):620-621. doi: 10.1136/gutjnl-2020-321949. Epub 2020 Jul 20. Gut. 2021. PMID: 32690603 Free PMC article. No abstract available.
References
-
- Correa P. Human gastric carcinogenesis: a multistep and multifactorial process--first American Cancer society award lecture on Cancer epidemiology and Prevention. Cancer Res 1992;52:6735–40. - PubMed
-
- Compare D, Rocco A, Nardone G. Risk factors in gastric Cancer. Eur Rev Med Pharmacol Sci 2010;14:302–8. - PubMed
Publication types
MeSH terms
Substances
LinkOut - more resources
Full Text Sources
Other Literature Sources
Medical
Miscellaneous