. 2017 Aug 2;18(8):1679.
doi: 10.3390/ijms18081679.

Do Multiwell Plate High Throughput Assays Measure Loss of Cell Viability Following Exposure to Genotoxic Agents?

Affiliations

Do Multiwell Plate High Throughput Assays Measure Loss of Cell Viability Following Exposure to Genotoxic Agents?

Razmik Mirzayans et al. Int J Mol Sci. .

Abstract

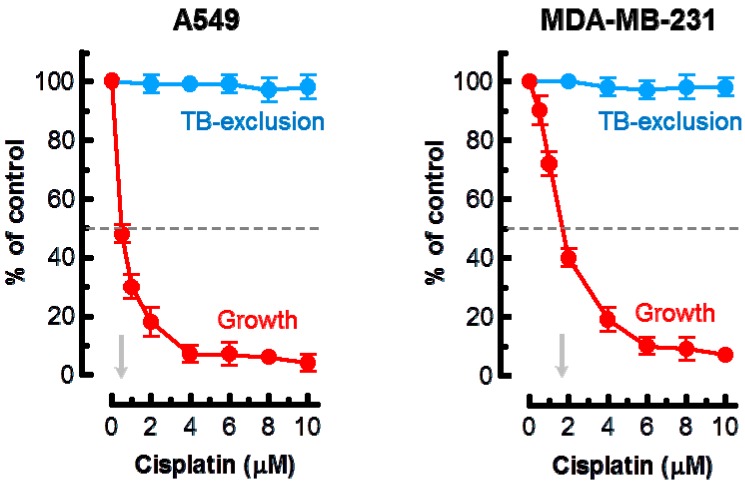
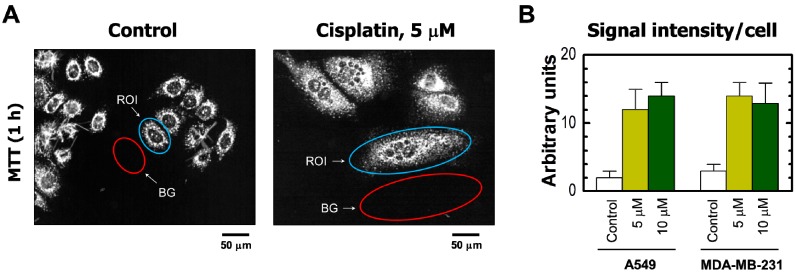
Cell-based assays in multiwell plates are widely used for radiosensitivity and chemosensitivity assessment with different mammalian cell types. Despite their relative ease of performance, such assays lack specificity as they do not distinguish between the cytostatic (reversible/sustained growth arrest) and cytotoxic (loss of viability) effects of genotoxic agents. We recently reported studies with solid tumor-derived cell lines demonstrating that radiosensitivity as measured by multiwell plate colorimetric (e.g., XTT) and fluorimetric (e.g., CellTiter-Blue) assays reflects growth arrest but not loss of viability. Herein we report similar observations with cancer cell lines expressing wild-type p53 (A549 lung carcinoma) or mutant p53 (MDA-MB-231 breast carcinoma) after treatment with the chemotherapeutic drug cisplatin. Importantly, we show that treatment of cancer cells with concentrations of cisplatin that result in 50% effect (i.e., IC50) in multiwell plate assays trigger the emergence of growth arrested cells that exhibit highly enlarged morphology, remain viable and adherent to the culture dish, and metabolize the tetrazolium salt 3-(4,5-dimethylthiazol-2-yl)-2,5-diphenyl-tetrazolium bromide (MTT) to its formazan derivative. The emergence of markedly enlarged viable cells complicates the interpretation of chemosensitivity data obtained with multiwell plate high throughput assays. Relying solely on IC50 values could be misleading.

Keywords: CellTiter-Blue; MTT; XTT; cisplatin; p53 signaling; premature senescence; proliferation; viability.


Conflict of interest statement

The authors declare no conflict of interest.

Figures

Figure 1
Figure 1
Effect of cisplatin treatment (3 days) on the extent of cell growth and viability of the indicated cell lines, determined by direct cell counting and the trypan blue-exclusion assay, respectively. Arrows show cisplatin concentrations resulting in 50% inhibition of growth. Bars, standard error (SE). TB, trypan blue.
Figure 2
Figure 2
(A) Representative bright-field microscopy images depicting the metabolic activity of A549 cells that were incubated with 0 μM (control) or 5 μM cisplatin for 3 days. Metabolic activity was measured by the ability of the cells to convert the yellow MTT to its purple formazan metabolite, which appears as dark granules and crystals. Upper row: images were acquired after incubation of cells with MTT for ~1 h. Lower row: images were acquired after incubating cells with MTT (~1 h), fixing them in methanol (MeOH) for 0.5 min to dissolve the MTT metabolite, removing the resulting purple medium, and mildly staining the fixed cells with trypan blue (TB) to visualize their morphology. All images were acquired at the same magnification. The border of some cells is marked in red for clarity. Images acquired for the MDA–MB-231 cell line were virtually identical to those shown for A549 (also see Figure 2A); (B) percentages of MTT-positive cells after the same treatments for both A549 and MDA–MB-231 cell lines. Bars, SE.
Figure 3
Figure 3
(A) Representative images of MDA–MB-231 cells used for image analysis. The images of MTT metabolites were acquired as described in Figure 2 legend (upper row). The images were then converted to grayscale and inverted. Blue and red ovals mark some regions of interest (reflecting MTT metabolites) and corresponding background regions used for image analysis, respectively; (B) densitometric evaluation of MTT metabolic activity for the indicated cultures, expressed as signal intensity for regions of interest (cells) after corresponding background corrections. Mean values for at least 30 cells are presented for each sample. Bars, SE. ROI, region of interest; BG, background.
Figure 4
Figure 4
Cisplatin sensitivity of the indicated cell lines evaluated by the 96-well plate XTT (solid squares) and CellTiter-Blue (open squares) assays. Bars, SE.

References

    1. Mirzayans R., Andrais B., Kumar P., Murray D. The growing complexity of cancer cell response to DNA-damaging agents: Caspase 3 mediates cell death or survival? Int. J. Mol. Sci. 2016;17:708. doi: 10.3390/ijms17050708. - DOI - PMC - PubMed
    1. Mirzayans R., Andrais B., Kumar P., Murray D. Significance of wild-type p53 signaling in suppressing apoptosis in response to chemical genotoxic agents: Impact on chemotherapy outcome. Int. J. Mol. Sci. 2017;18:928. doi: 10.3390/ijms18050928. - DOI - PMC - PubMed
    1. Coppé J.P., Desprez P.Y., Krtolica A., Campisi J. The senescence-associated secretory phenotype: The dark side of tumor suppression. Annu. Rev. Pathol. 2010;5:99–118. - PMC - PubMed
    1. Davalos A.R., Coppé J.P., Campisi J., Desprez P.Y. Senescent cells as a source of inflammatory factors for tumor progression. Cancer Metastasis Rev. 2010;29:273–283. doi: 10.1007/s10555-010-9220-9. - DOI - PMC - PubMed
    1. Sikora E., Mosieniak G., Sliwinska M.A. Morphological and functional characteristic of senescent cancer cells. Curr. Drug Targets. 2016;17:377–387. doi: 10.2174/1389450116666151019094724. - DOI - PubMed

MeSH terms