. 2017 Aug 31;548(7669):607-611.
doi: 10.1038/nature23671. Epub 2017 Aug 2.

ISWI chromatin remodellers sense nucleosome modifications to determine substrate preference

Affiliations

ISWI chromatin remodellers sense nucleosome modifications to determine substrate preference

Geoffrey P Dann et al. Nature. .

Abstract

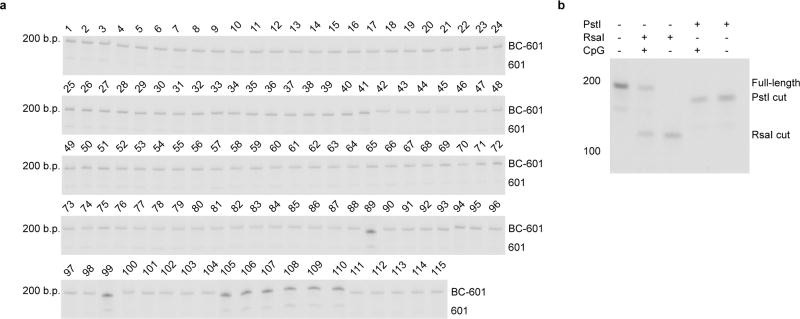
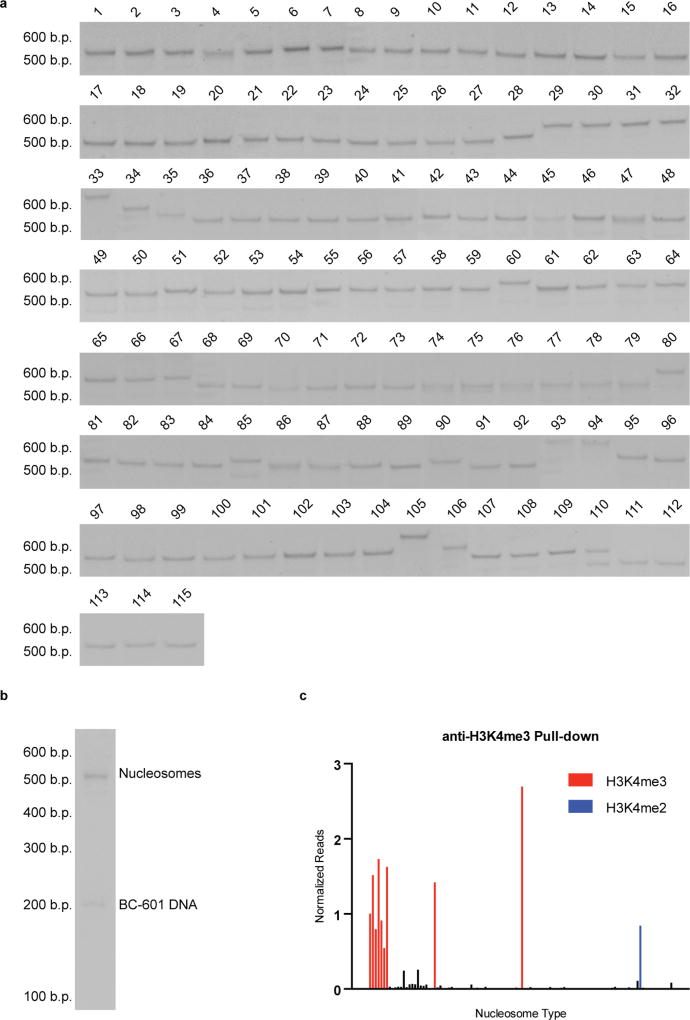
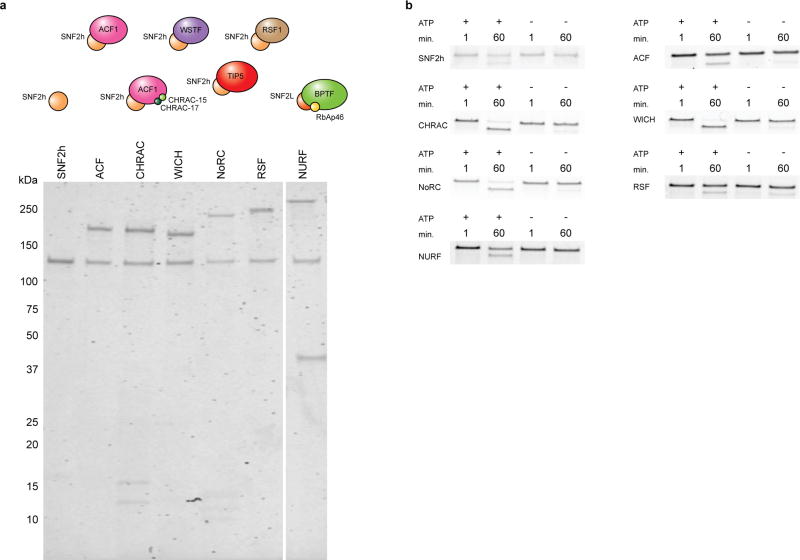
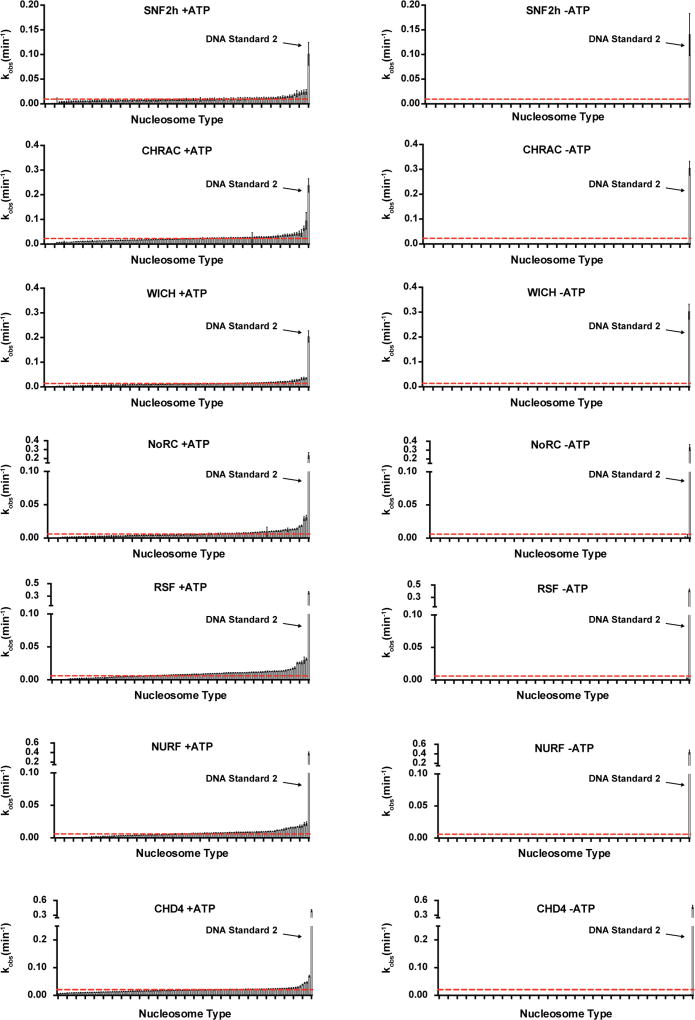
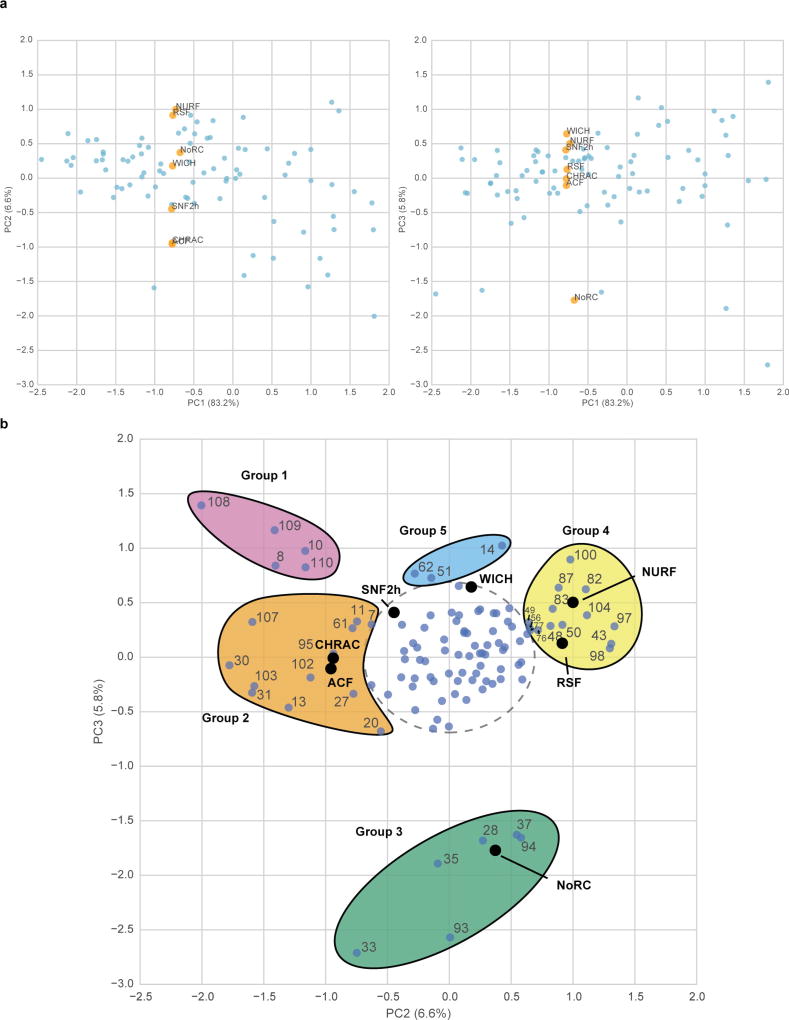
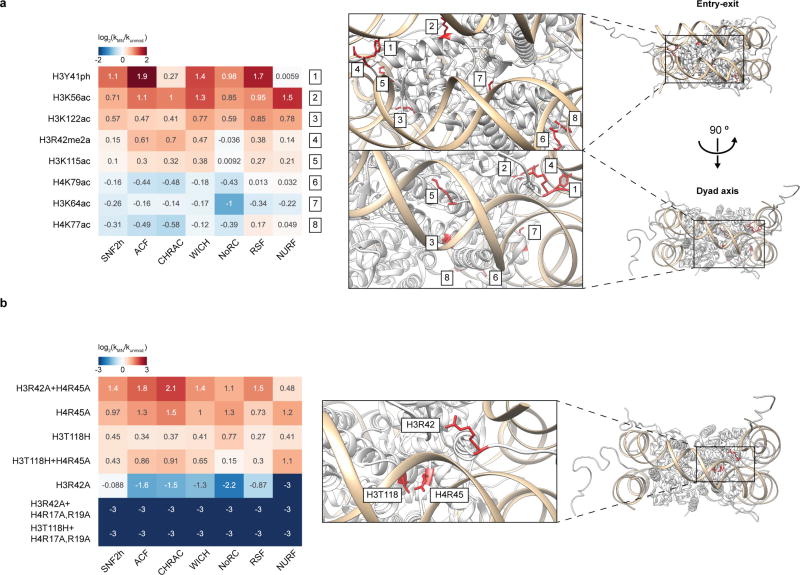
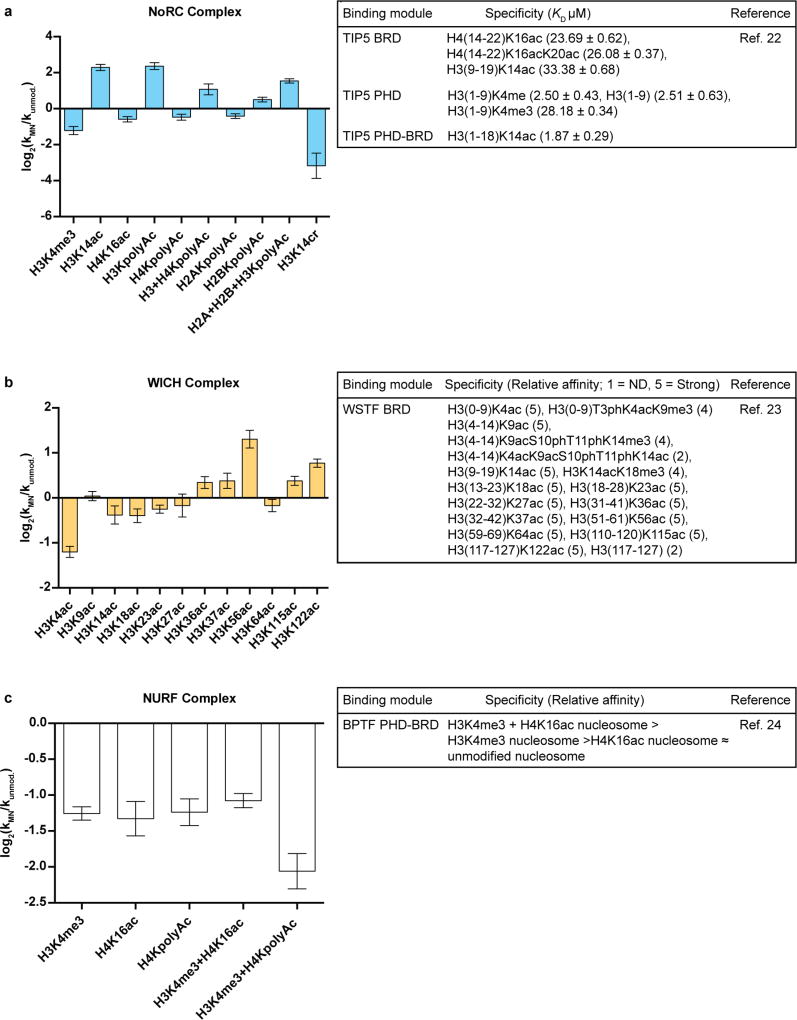
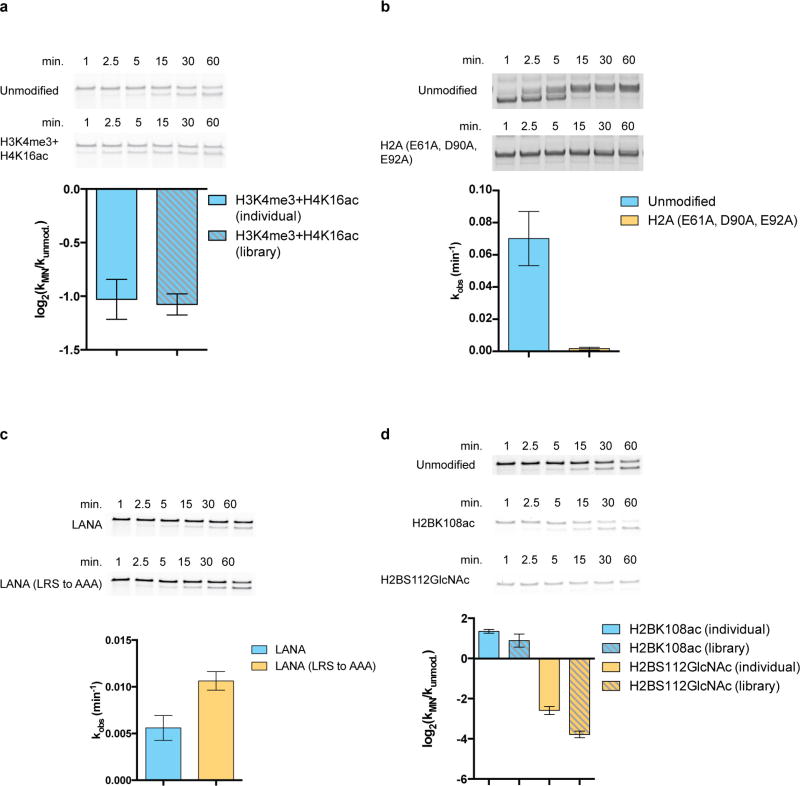
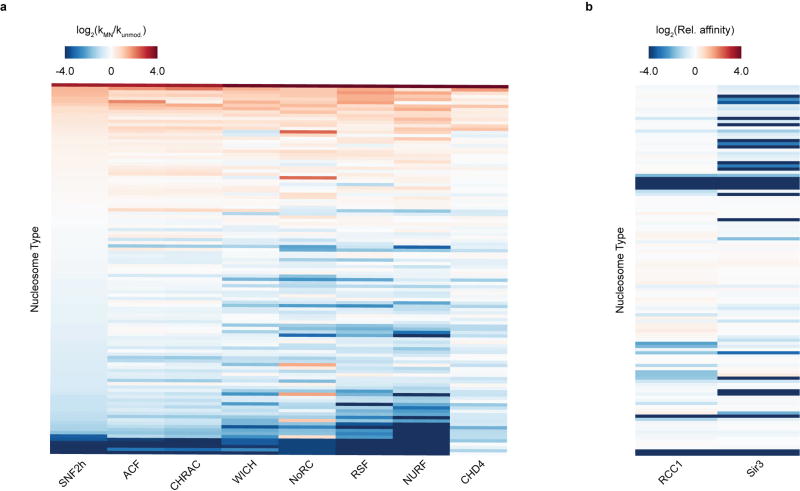
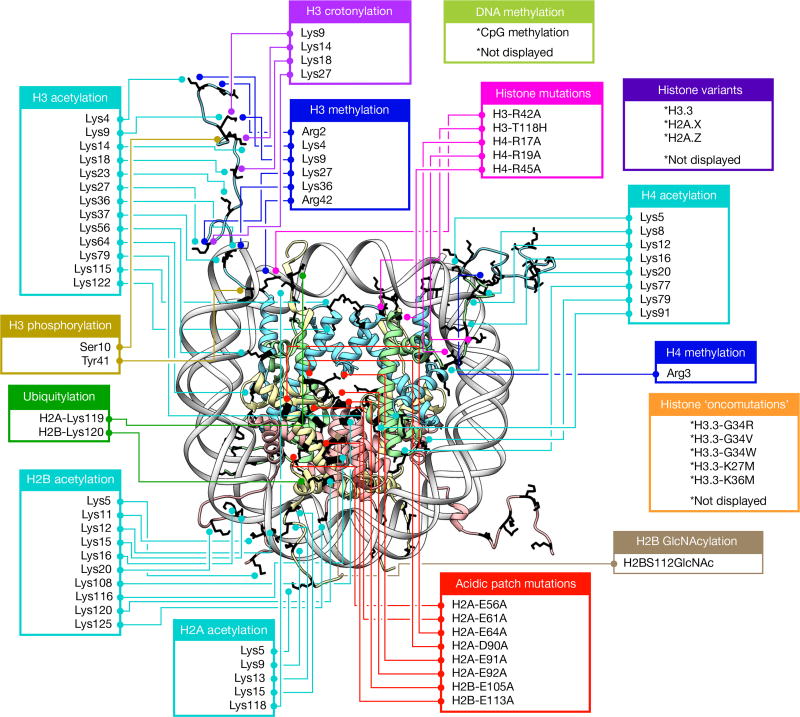
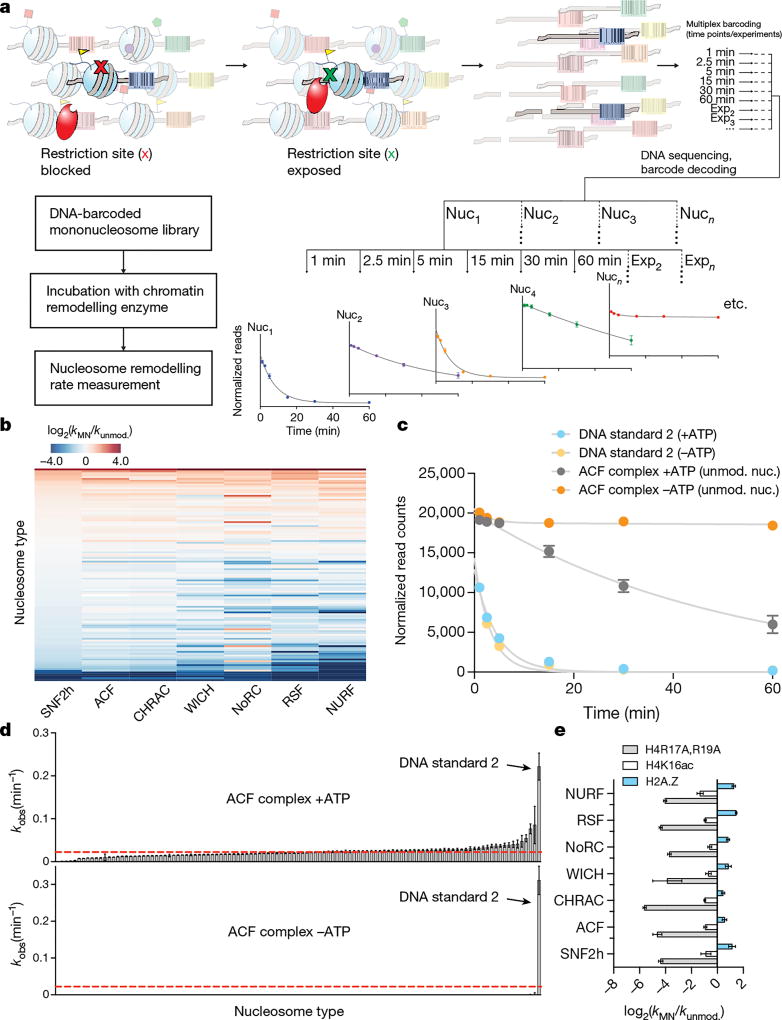
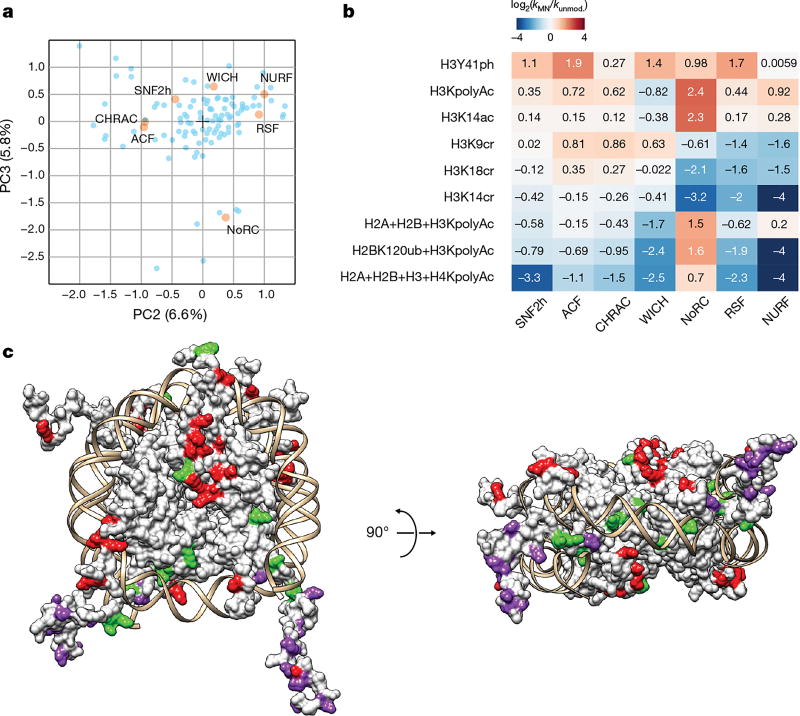
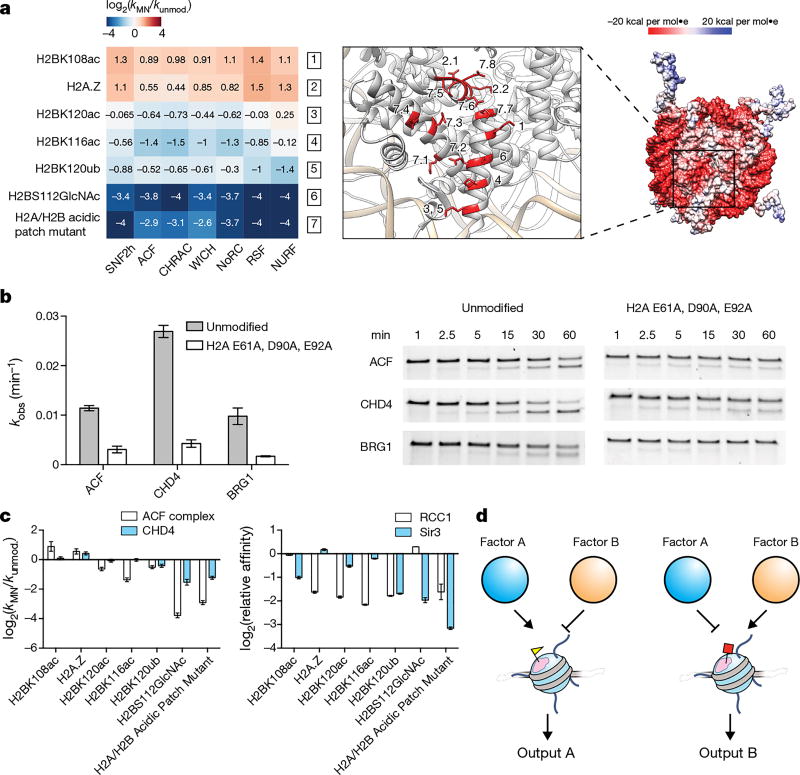
ATP-dependent chromatin remodellers regulate access to genetic information by controlling nucleosome positions in vivo. However, the mechanism by which remodellers discriminate between different nucleosome substrates is poorly understood. Many chromatin remodelling proteins possess conserved protein domains that interact with nucleosomal features. Here we used a quantitative high-throughput approach, based on the use of a DNA-barcoded mononucleosome library, to profile the biochemical activity of human ISWI family remodellers in response to a diverse set of nucleosome modifications. We show that accessory (non-ATPase) subunits of ISWI remodellers can distinguish between differentially modified nucleosomes, directing remodelling activity towards specific nucleosome substrates according to their modification state. Unexpectedly, we show that the nucleosome acidic patch is necessary for maximum activity of all ISWI remodellers evaluated. This dependence also extends to CHD and SWI/SNF family remodellers, suggesting that the acidic patch may be generally required for chromatin remodelling. Critically, remodelling activity can be regulated by modifications neighbouring the acidic patch, signifying that it may act as a tunable interaction hotspot for ATP-dependent chromatin remodellers and, by extension, many other chromatin effectors that engage this region of the nucleosome surface.


Conflict of interest statement

The authors declare no competing financial interests.

Figures

Extended Data Figure 1
Extended Data Figure 1. Characterization of barcoded 601 (BC-601) DNA
a, BC-601 DNA prepared for all 115 nucleosome library members as described in Methods (Barcoded 601 (BC-601) DNA preparation). Ligation products are 192 bp in size and were visualized by polyacrylamide gel electrophoresis (5% acrylamide, 0.5× TBE, 200 V, 40 min) and staining with SYBR Safe DNA gel stain. A faint band corresponding to unligated 601 DNA (601) is slightly visible in certain cases. b, BC-601 DNA for nucleosome 99 (Supplementary Table 1) was CpG methylated by the M.SssI methyltransferase (NEB) according to the manufacturer’s instructions and characterized by digestion with the RsaI restriction enzyme, which is sensitive to CpG methylation, and PstI, which is not. For gel source data, see Supplementary Fig. 1.
Extended Data Figure 2
Extended Data Figure 2. Analysis of the quality and integrity of the nucleosome library
a, b, Analysis of individual nucleosome preparations (a) and the final library after pooling of nucleosomes (b) by native gel electrophoresis and staining with ethidium bromide. c, Antibody pull-down of library members using an anti-H3K4me3 antibody. Every nucleosome member containing an H3K4me3 mark (red) was efficiently isolated relative to other library members (black). Notably, the antibody was also able to pull down a nucleosome possessing solely the H3K4me2 mark (blue), indicating a lack of antibody specificity in this case. This experiment was performed once. For gel source data, see Supplementary Fig. 1.
Extended Data Figure 3
Extended Data Figure 3. Characterization of recombinant ISWI chromatin remodellers
a, Purified chromatin remodellers were run a 4–20% Mini-PROTEAN TGX gel (Bio-Rad) and for 35 min at 180 V. Proteins were stained with Coomassie. The composition of each remodeller–remodelling complex is depicted above each respective lane on the gel. Expected molecular weights: SNF2h: 122 kDa, ACF1: 179 kDa, CHRAC-15: 14.7 kDa, CHRAC-17: 16.9 kDa, WSTF: 171 kDa, TIP5: 208 kDa, RSF1: 164 kDa; migrates at higher apparent molecular weight, SNF2L: 121 kDa, BPTF: 338 kDa, RbAp46: 47.8 kDa. b, All remodellers display ATP-dependent nucleosome remodelling activity as detected by a restriction enzyme accessibility assay. For gel source data, see Supplementary Fig. 1.
Extended Data Figure 4
Extended Data Figure 4. Nucleosome remodelling activity is negligible in the absence of ATP
Bar graphs show individual DNA cleavage rates (kMN, remodelling rates in the case of nucleosomes; see Supplementary Table 3) from library remodelling experiments for each member of the library in the presence of the indicated chromatin remodeller with and without ATP. Rate values were rank ordered and are displayed from low to high. The dashed red line represents the rate of remodelling of unmodified nucleosomes. The related graphs for the ACF complex can be found in Fig. 2d. Data are represented as the mean of experimental replicates ± s.e.m. (n = 3).
Extended Data Figure 5
Extended Data Figure 5. Principal component (PC) analysis of library remodelling data
Percentages show the fractions of the variance accounted for by each PC. Individual nucleosomes are shown in light blue, and PC weight values for each remodeller are shown in either orange or black. Weights are scaled by a factor of 2 for visibility. a, PC1 vs. PC2 and PC1 vs. PC3 are plotted. b, PC2 vs. PC3 are plotted as in Fig. 3a. Nucleosomes driving differences in remodeller activity were numbered as in Supplementary Table 1 and grouped by their location in PC space (Supplementary Table 4).
Extended Data Figure 6
Extended Data Figure 6. Alteration of histone–DNA contacts affects remodelling activity
a, Modified histone residues in the nucleosome library that lie under the DNA (tan) are highlighted on the nucleosome (PDB: 1KX5) in red. PTMs are numbered and labelled on the nucleosome structure. Values were capped at −2 and 2 for display purposes. b, Histone mutants present in the nucleosome library that lie under the DNA (tan) are highlighted on the nucleosome (PDB: 1KX5) in red. The heatmap is displayed as in a. Locations of each mutation are individually labelled on the nucleosome structure. Values were capped at −3 and 3 for display purposes. All histones are unmodified unless otherwise specified.
Extended Data Figure 7
Extended Data Figure 7. Remodelling of nucleosomes containing modifications preferred by histone recognition domains
Library remodelling data generated by the NoRC (a), WICH (b), and NURF (c) complexes for nucleosomes containing residues known to interact with histone binding modules in accessory subunits of each complex (NoRC: TIP5; WICH: WSTF; NURF: BPTF). Literature binding specificities are displayed in corresponding tables on the right. Bar graphs display log2 values of the rate of remodelling of individual nucleosome library members (kMN) relative to unmodified nucleosomes (kunmod.). Data are represented as the ratio of the mean of experimental replicates ± s.e.m. (n = 3). Note that H3KpolyAc includes the H3K14ac modification (Supplementary Table 1). All histones are unmodified unless otherwise specified. BRD, bromodomain; PHD, PHD-finger; PHD–BRD, tandem PHD-finger–bromodomain module; ND, not determined.
Extended Data Figure 8
Extended Data Figure 8. Remodelling assays carried out on individual nucleosomes measured via standard gel-based read-out to validate library data
a, Activity of the NURF complex towards H3K4me3+H4K16ac relative to unmodified nucleosomes as measured in the context of the nucleosome library (library) or individual assays (individual). b, Activity of the ACF complex on unmodified and acidic patch mutant nucleosomes. c, Remodelling of unmodified nucleosomes is inhibited by the presence of the LANA peptide when compared to a LANA peptide with key binding residues mutated (LRS to AAA). d, Activity of the ACF complex towards nucleosomes modified near the acidic patch (H2BK108ac and H2BS112GlcNac) relative to unmodified nucleosomes as measured in the context of the nucleosome library (library) or individual assays (individual). Gel images of example replicates used to generate densitometry measurements in each subpanel are shown above respective graphs. a, c, and d use a restriction enzyme accessibility assay. b uses a nucleosome repositioning electrophoretic mobility shift assay. All histones are unmodified unless otherwise specified. All data are represented as the mean of experimental replicates ± s.e.m. (n = 3). For gel source data, see Supplementary Fig. 1.
Extended Data Figure 9
Extended Data Figure 9. High-throughput chromatin remodelling and binding data
a, Heat-map displaying ISWI remodelling data (as in Fig. 2b) against the nucleosome library with CHD4 data for comparison. Rows were sorted on the basis of values for SNF2h (low to high). b, Heat map displaying binding of chromatin factors RCC1 and Sir3 against the nucleosome library relative to unmodified nucleosomes. Values were capped at − 4 and 4 for display purposes. All data are represented as the mean of experimental replicates (n = 3).
Figure 1
Figure 1. A diverse library of modified nucleosomes
Diagram depicting all histone modifications, mutants, and variants present in the 115-member nucleosome library used in this study. Residues modified or mutated were mapped on to the nucleosome (PDB: 1KX5) in black using UCSF Chimera. H2A (light yellow), H2B (light red), H3 (light blue) and H4 (light green) modification and mutation locations are indicated by boxes and lines. For clarity, connections are shown to only a single copy of each histone protein.
Figure 2
Figure 2. A high-throughput nucleosome remodelling assay for ISWI family chromatin remodellers
a, Schematic of the restriction enzyme accessibility assay used with the DNA-barcoded library. Individual remodelling rates are calculated from unique DNA sequencing reads. b, Heat map displaying ISWI remodelling data against the nucleosome library. Rows were sorted on the basis of values for SNF2h (low to high). kMN, nucleosome remodelling rate; kunmod., unmodified nucleosome remodelling rate. Values were capped at −4 and 4 for display purposes. c, Example decay curves depicting individual rates (kMN) as in b. d, Rank-ordered remodelling rates for the ACF complex (kMN) against the library. Dashed red line, kunmod. e, Relative remodelling rates as in b for select library members. All data are represented as the mean of experimental replicates (n = 3). Error bars represent s.e.m. All histones are unmodified unless otherwise specified.
Figure 3
Figure 3. Specialization of ISWI remodellers for diverse nucleosome modifications
a, Principal component analysis of library remodelling data. Nucleosomes, light blue; principal component (PC) weight values for remodellers, orange. Weights are scaled by a factor of 2 for visibility. b, ISWI remodelling data for selected nucleosome substrates in the library. Values capped at −4 and 4 for display purposes. All histones are unmodified unless otherwise specified. c, Single-site modifications mapped onto the nucleosome (PDB: 1KX5) and coloured according to whether they had consistently positive (green), consistently negative (red), or variable (purple) effects on nucleosome remodelling activity across all ISWI remodellers analysed.
Figure 4
Figure 4. The nucleosome acidic patch is crucial for remodelling and regulatable by histone PTMs
a, Right, Coulombic surface rendering of the nucleosome (PDB: 1KX5). Left, effect of acidic patch modifications and mutations on ISWI remodelling activity. Mutations and PTM locations are individually numbered on the nucleosome structure (middle) with decimals indicating multiple changes per nucleosome (7.1, H2AE56A; 7.2, H2BE113A; 7.3, H2AE61A; 7.4, H2AE64A; 7.5, H2AD90A; 7.6, H2AE92A; 7.7, H2BE105A; 7.8, H2AE91A; 2.1, N94D (H2A→ H2A.Z); 2.2, K95S (H2A→ H2A.Z). Values capped at −4 and 4 for display purposes. b, E61A, D90A, and E92A mutations in H2A reduce remodelling activity of the ACF complex, CHD4, and BRG1 as read out by a gel-based restriction enzyme accessibility assay (corresponding example replicates shown on right). c, Acidic patch modifications differentially affect remodelling activity and binding of chromatin factors relative to unmodified nucleosomes. For complete datasets see Extended Data Fig. 9, Supplementary Table 3 and Supplementary Table 7. d, Model of how histone modifications (yellow triangle, red square) proximal to the acidic patch (pink) might differentially regulate the binding and function of chromatin factors. For a–c all histones are unmodified unless otherwise specified. For b and c data are represented as the mean of experimental replicates (n = 3). Error bars represent s.e.m. For gel source data, see Supplementary Fig. 1.

References

    1. Jiang C, Pugh BF. Nucleosome positioning and gene regulation: advances through genomics. Nat. Rev. Genet. 2009;10:161–172. - PMC - PubMed
    1. Clapier CR, Cairns BR. The biology of chromatin remodeling complexes. Annu. Rev. Biochem. 2009;78:273–304. - PubMed
    1. Luger K, Mäder AW, Richmond RK, Sargent DF, Richmond TJ. Crystal structure of the nucleosome core particle at 2.8 Å resolution. Nature. 1997;389:251–260. - PubMed
    1. Morgan MT, et al. Structural basis for histone H2B deubiquitination by the SAGA DUB module. Science. 2016;351:725–728. - PMC - PubMed
    1. Makde RD, England JR, Yennawar HP, Tan S. Structure of RCC1 chromatin factor bound to the nucleosome core particle. Nature. 2010;467:562–566. - PMC - PubMed

Publication types