. 2017 Oct;174(20):3654-3668.
doi: 10.1111/bph.13968. Epub 2017 Aug 30.

Carbon monoxide released from its pharmacological donor, tricarbonyldichlororuthenium (II) dimer, accelerates the healing of pre-existing gastric ulcers

Affiliations

Carbon monoxide released from its pharmacological donor, tricarbonyldichlororuthenium (II) dimer, accelerates the healing of pre-existing gastric ulcers

Marcin Magierowski et al. Br J Pharmacol. 2017 Oct.

Abstract

Background and purpose: Carbon monoxide (CO), a gaseous mediator produced by haem oxygenases (HOs), has been shown to prevent stress-, ethanol-, aspirin- and alendronate-induced gastric damage; however, its role in gastric ulcer healing has not been fully elucidated. We investigated whether CO released from tricarbonyldichlororuthenium (II) dimer (CORM-2) can affect gastric ulcer healing and determined the mechanisms involved in this healing action.

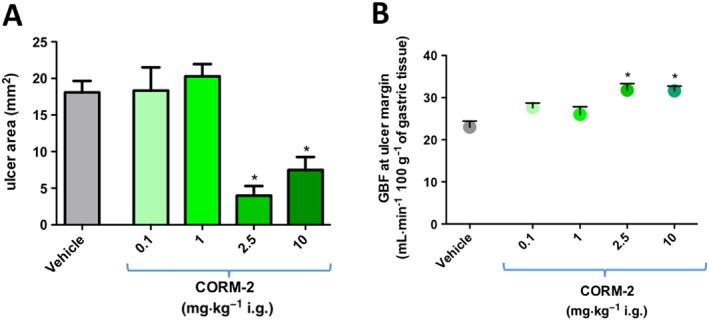
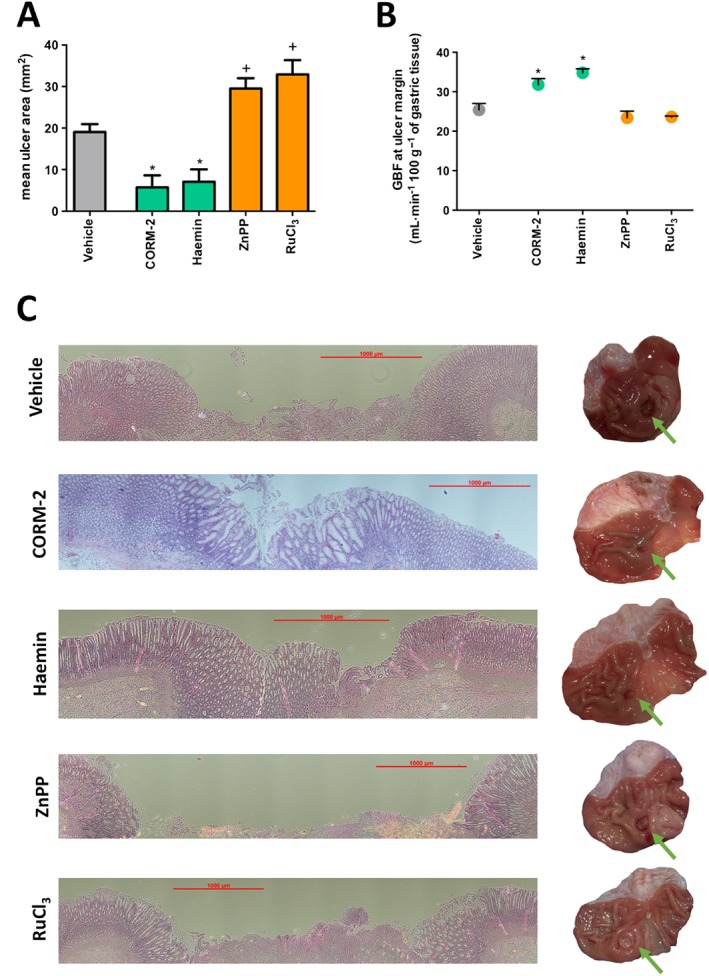
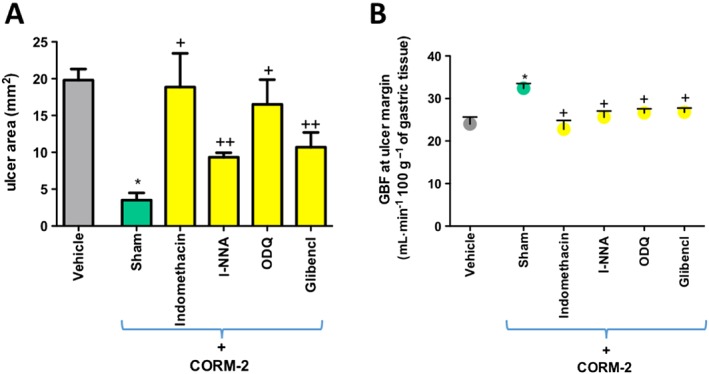
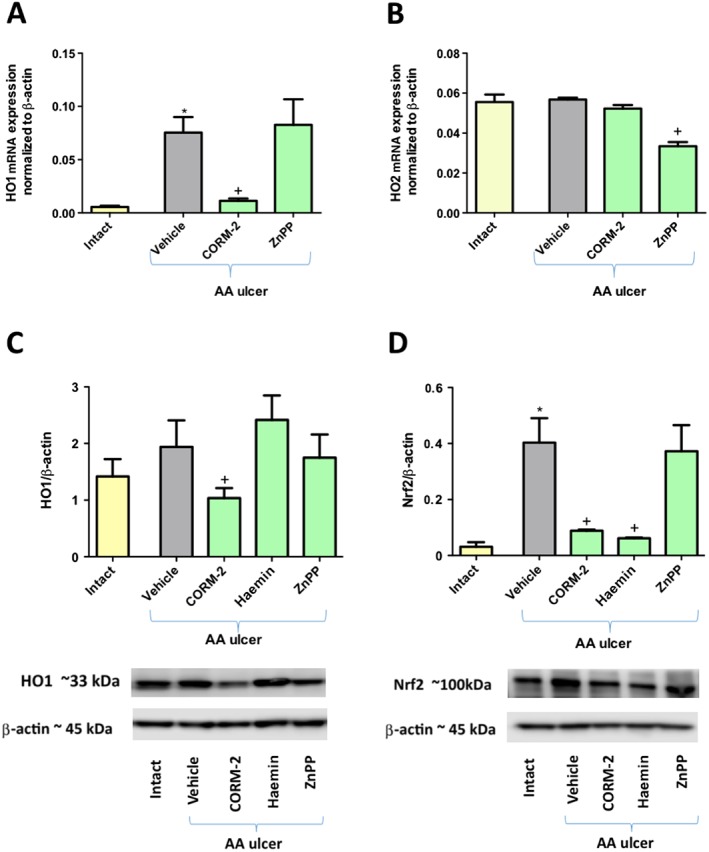
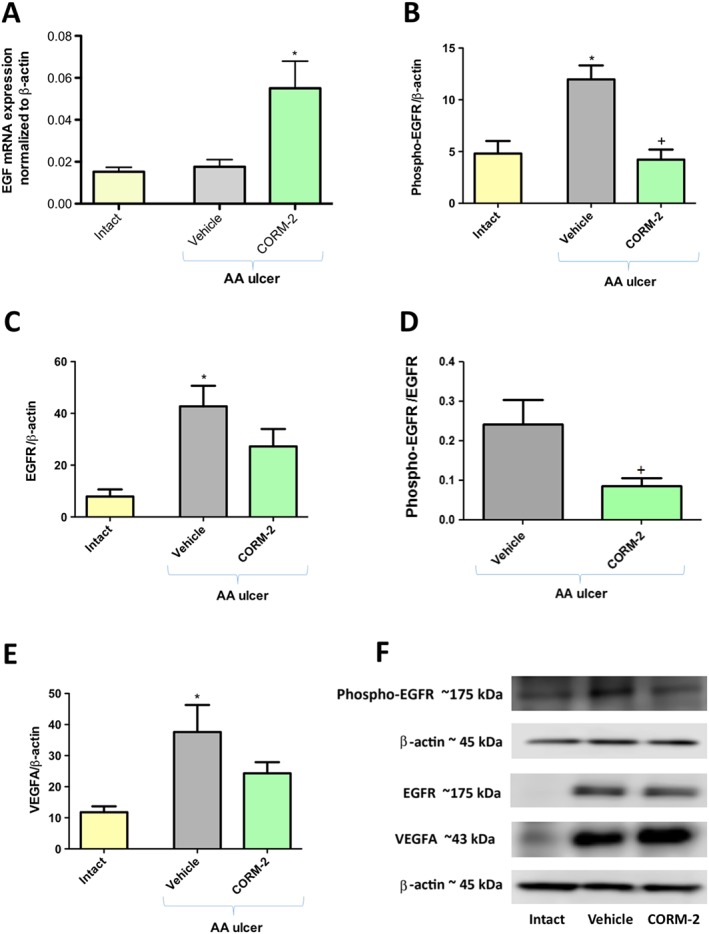
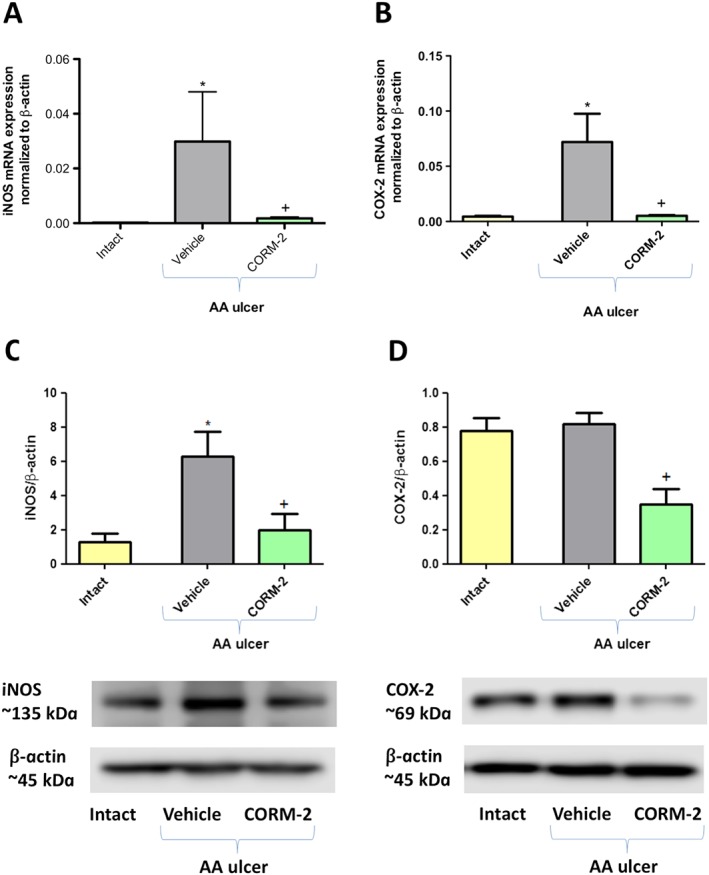
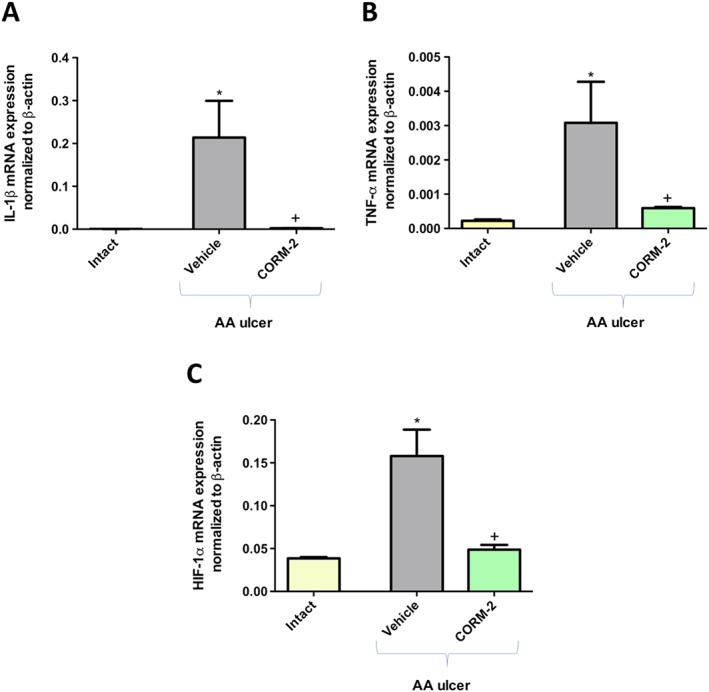
Experimental approach: Gastric ulcers were induced in Wistar rats by serosal application of acetic acid. Animals received 9 days of treatment with RuCl3 [2.5 mg·kg-1 intragastrically (i.g.)], haemin (5 mg·kg-1 i.g.), CORM-2 (0.1-10 mg·kg-1 i.g.) administered alone or with zinc protoporphyrin IX (ZnPP, 10 mg·kg-1 i.g.), 1H-[1,2,4]oxadiazolo[4,3-a]quinoxalin-1-one (ODQ, 5 mg·kg-1 i.g.), NG -nitro-l-arginine (l-NNA, 15 mg·kg-1 i.g.), indomethacin (5 mg·kg-1 i.g.) or glibenclamide (10 mg·kg-1 i.g.). Gastric ulcer area and gastric blood flow (GBF) were assessed planimetrically, microscopically and by laser flowmeter respectively. Gastric mRNA/protein expressions of EGF, EGF receptors, VEGFA, HOs, nuclear factor (erythroid-derived 2)-like 2 (Nrf2), COX-2, hypoxia-inducible factor (HIF)-1α and pro-inflammatory iNOS, IL-1β and TNF-α were determined by real-time PCR or Western blots.

Key results: CORM-2 and haemin but not RuCl3 or ZnPP decreased ulcer size while increasing GBF. These effects were reduced by ODQ, indomethacin, l-NNA and glibenclamide. CORM-2 significantly decreased the expression of pro-inflammatory markers, Nrf2/HO1 and HIF-1α, and up-regulated EGF.

Conclusions and implications: CO released from CORM-2 or endogenously produced by the HO1/Nrf2 pathway accelerates gastric ulcer healing via an increase in GBF, an up-regulation in EGF expression and down-regulation of the inflammatory response.


Figures

Figure 1
Figure 1
The effect of CORM‐2 on ulcer size and GBF at the ulcer margin. (A) Gastric ulcer area in rats after 9 days of i.g. treatment with vehicle or CORM‐2 (0.1–10 mg·kg−1·day−1). (B) GBF at the ulcer margin. Results are expressed as mean ± SEM for n = 5 rats per experimental group. Asterisk (*) indicates significant change as compared with vehicle control group (P < 0.05).
Figure 2
Figure 2
The effect of daily treatment with CORM‐2, haemin, ZnPP and RuCl3 on changes in ulcer area and GBF at the ulcer margin. (A) Mean area of gastric ulcer in rats after 9 days of daily i.g. treatment with vehicle, CORM‐2 (2.5 mg·kg−1), haemin (5 mg·kg−1), ZnPP (10 mg·kg−1) or RuCl3 (2.5 mg·kg−1). (B) GBF at the ulcer margin. Results are expressed as mean ± SEM for n = 5 rats per experimental group. Asterisk (*) or cross (+) indicates significant change as compared with vehicle control group (P < 0.05). (C) Microscopic and macroscopic appearance of representative gastric mucosa with gastric ulcer. Images were collected from gastric mucosa of rats 9 days after the induction of a gastric ulcer by administration of acetic acid followed by the daily treatment with vehicle, CORM‐2 (2.5 mg·kg−1 i.g.), haemin (5 mg·kg−1 i.g.), ZnPP (10 mg·kg−1 i.g.) or RuCl3 (2.5 mg·kg−1 i.g.). Green arrows show macroscopic appearance of gastric ulcer in each experimental group.
Figure 3
Figure 3
Concurrent treatment with indomethacin, l‐NNA, ODQ or glibenclamide attenuates CORM‐2‐induced decrease in area of gastric ulcer and increase in GBF at the ulcer margin. (A) Mean gastric ulcer area in rats after 9 days of i.g. treatment with vehicle or CORM‐2 (2.5 mg·kg−1·day−1) administered alone (sham) or in combination with indomethacin (5 mg·kg−1), l‐NNA (15 mg·kg−1), ODQ (5 mg·kg−1) or glibenclamide (glibencl, 10 mg·kg−1). (B) GBF at the ulcer margin. Results are expressed as mean ± SEM for n = 5 rats per experimental group. Asterisk (*) indicates a significant change as compared with vehicle control group (P < 0.05). Significant change as compared with the group treated with CORM‐2 alone is indicated by cross (+) (P < 0.05). Double crosses (++) indicate a significant change as compared with vehicle‐alone or CORM‐2‐alone treated groups (P < 0.05).
Figure 4
Figure 4
Alterations in HO1, HO2 mRNA and HO1 and Nrf2 protein expression in healthy gastric mucosa and at the ulcer margin. (A) Expression of mRNA for HO1 in healthy gastric mucosa (intact) and at the gastric ulcer margin [acetic acid (AA) induced ulcer] observed after 9 days of i.g. treatment with vehicle, CORM‐2 (2.5 mg·kg−1) or ZnPP (10 mg·kg−1). (B) Expression of mRNA for HO2 in healthy gastric mucosa (intact) and at the gastric ulcer margin observed after 9 days of i.g. treatment with vehicle, CORM‐2 or ZnPP. (C) Protein expression and representative bands for HO1 and β‐actin proteins (lower panel) in healthy gastric mucosa (intact) and at gastric ulcer margin (AA ulcer) after 9 days of i.g. treatment with vehicle, CORM‐2, dose of haemin or ZnPP. (D) Protein expression and representative bands for Nrf2 and β‐actin proteins (lower panel) in healthy gastric mucosa (intact) and at gastric ulcer margin (AA ulcer) 9 days of i.g. treatment with vehicle, CORM‐2, haemin or ZnPP. Results are expressed as mean ± SEM for n = 5 samples per experimental group. Asterisk (*) indicates significant change as compared with healthy gastric mucosa (intact) (P < 0.05). Significant change as compared with the vehicle‐treated animals is indicated by a cross (+) (P < 0.05).
Figure 5
Figure 5
Expression of mRNA for EGF and protein expression of EGFR, phospho‐EGFR and VEGFA in healthy gastric mucosa and at the ulcer margin. (A) Expression of mRNA for EGF in healthy gastric mucosa (intact) or at the ulcer margin [acetic acid (AA) induced ulcer] in rats treated daily with vehicle or CORM‐2 for 9 days. (B) Protein expression for EGFR in healthy gastric mucosa (intact) and at gastric ulcer margin (AA ulcer) after 9 days of i.g. treatment with vehicle or CORM‐2 (2.5 mg·kg−1·day−1). (C) Protein expression for phospho‐EGFR in healthy gastric mucosa (intact) and at gastric ulcer margin (AA ulcer) after 9 days of i.g. treatment with vehicle or CORM‐2 (2.5 mg·kg−1·day−1). (D) The ratio of phospho‐EGFR/EGFR protein expression in rats with AA ulcer treated i.g. for 9 days with vehicle or CORM‐2. (E) Protein expression for VEGFA in healthy gastric mucosa (intact) and at gastric ulcer margin (AA ulcer) after 9 days of i.g. treatment with vehicle or CORM‐2. (F) Representative bands of protein expression for EGFR, phospho‐EGFR, VEGFA and respective β‐actin in healthy gastric mucosa (intact) and at gastric ulcer margin (AA ulcer) after 9 days of i.g. treatment with vehicle or CORM‐2. Results are expressed as mean ± SEM for n = 5 samples per experimental group. Asterisk (*) indicates significant change as compared with healthy gastric mucosa (intact) (P < 0.05). Significant change as compared with the vehicle‐treated animals is indicated by a cross (+) (P < 0.05).
Figure 6
Figure 6
Expression of mRNA and protein for iNOS and COX‐2 at the ulcer margin and in healthy gastric mucosa. (A) Expression of mRNA for iNOS in healthy gastric mucosa (intact) and at the gastric ulcer margin [acetic acid (AA) induced ulcer] after 9 days of i.g. treatment with vehicle or CORM‐2 (2.5 mg·kg−1·day−1). (B) Expression of mRNA for COX‐2 in healthy gastric mucosa (intact) and at the gastric ulcer margin (AA ulcer) after 9 days of i.g. treatment with vehicle or CORM‐2 (2.5 mg·kg−1·day−1). (C) Expression of iNOS protein and representative bands of protein expression for iNOS and β‐actin in healthy gastric mucosa (intact) and at the gastric ulcer margin (AA ulcer) after 9 days of i.g. treatment with vehicle or CORM‐2. (D) Expression of COX‐2 protein and representative bands of protein expression for COX‐2 and β‐actin in healthy gastric mucosa (intact) and at the gastric ulcer margin (AA ulcer) after 9 days of i.g. treatment with vehicle or CORM‐2. Results are expressed as mean ± SEM for n = 5 samples per experimental group. Asterisk (*) indicates significant change as compared with healthy gastric mucosa (intact) (P < 0.05). Significant change as compared with the vehicle‐treated animals is indicated by a cross (+) (P < 0.05).
Figure 7
Figure 7
Expression of mRNA for IL‐1β, TNF‐α and HIF‐1α at the ulcer margin and in healthy gastric mucosa. (A) Expression of mRNA for IL‐1β in healthy gastric mucosa (intact) and at the gastric ulcer margin [acetic acid (AA) induced ulcer] after 9 days of i.g. treatment with vehicle or CORM‐2 (2.5 mg·kg−1·day−1). (B) Expression of mRNA for TNF‐α in healthy gastric mucosa (intact) and at the gastric ulcer margin (AA ulcer) after 9 days of i.g. treatment with vehicle or CORM‐2 (2.5 mg·kg−1·day−1). (C) Expression of mRNA for HIF‐1α in healthy gastric mucosa (intact) and at the gastric ulcer margin (AA ulcer) after 9 days of i.g. treatment with vehicle or CORM‐2. Results are expressed as mean ± SEM for n = 5 samples per experimental group. Asterisk (*) indicates significant change as compared with healthy gastric mucosa (intact) (P < 0.05). Significant change as compared with the vehicle‐treated animals is indicated by a cross (+) (P < 0.05).

Similar articles

Cited by

References

    1. Alexander SPH, Fabbro D, Kelly E, Marrion N, Peters JA, Benson HE et al (2015a). The Concise Guide to PHARMACOLOGY 2015/16: Catalytic receptors. Br J Pharmacol 172: 5979–6023. - PMC - PubMed
    1. Alexander SPH, Fabbro D, Kelly E, Marrion N, Peters JA, Benson HE et al (2015b). The Concise Guide to PHARMACOLOGY 2015/16: Enzymes. Br J Pharmacol 172: 6024–6109. - PMC - PubMed
    1. Brancaleone V, Roviezzo F, Vellecco V, De Gruttola L, Bucci M, Cirino G (2008). Biosynthesis of H2S is impaired in non‐obese diabetic (NOD) mice. Br J Pharmacol 155: 673–680. - PMC - PubMed
    1. Bucci M, Papapetropoulos A, Vellecco V, Zhou Z, Zaid A, Giannogonas P et al (2012). cGMP‐dependent protein kinase contributes to hydrogen sulfide‐stimulated vasorelaxation. PLoS One 7: e53319, https://doi.org/10.1371/journal.pone.0053319. - DOI - PMC - PubMed
    1. Cacanyiova S, Berenyiova A, Kristek F, Drobna M, Ondrias K, Grman M (2016). The adaptive role of nitric oxide and hydrogen sulphide in vasoactive responses of thoracic aorta is triggered already in young spontaneously hypertensive rats. J Physiol Pharmacol 67: 501–512. - PubMed

MeSH terms

Substances