. 2017 Aug 3;2(15):e91588.
doi: 10.1172/jci.insight.91588.

Nonmyocyte ERK1/2 signaling contributes to load-induced cardiomyopathy in Marfan mice

Affiliations

Nonmyocyte ERK1/2 signaling contributes to load-induced cardiomyopathy in Marfan mice

Rosanne Rouf et al. JCI Insight. .

Abstract

Among children with the most severe presentation of Marfan syndrome (MFS), an inherited disorder of connective tissue caused by a deficiency of extracellular fibrillin-1, heart failure is the leading cause of death. Here, we show that, while MFS mice (Fbn1C1039G/+ mice) typically have normal cardiac function, pressure overload (PO) induces an acute and severe dilated cardiomyopathy in association with fibrosis and myocyte enlargement. Failing MFS hearts show high expression of TGF-β ligands, with increased TGF-β signaling in both nonmyocytes and myocytes; pathologic ERK activation is restricted to the nonmyocyte compartment. Informatively, TGF-β, angiotensin II type 1 receptor (AT1R), or ERK antagonism (with neutralizing antibody, losartan, or MEK inhibitor, respectively) prevents load-induced cardiac decompensation in MFS mice, despite persistent PO. In situ analyses revealed an unanticipated axis of activation in nonmyocytes, with AT1R-dependent ERK activation driving TGF-β ligand expression that culminates in both autocrine and paracrine overdrive of TGF-β signaling. The full compensation seen in wild-type mice exposed to mild PO correlates with enhanced deposition of extracellular fibrillin-1. Taken together, these data suggest that fibrillin-1 contributes to cardiac reserve in the face of hemodynamic stress, critically implicate nonmyocytes in disease pathogenesis, and validate ERK as a therapeutic target in MFS-related cardiac decompensation.

Keywords: Cardiology; Genetics.


Conflict of interest statement

Conflict of interest: The authors have declared that no conflict of interest exists.

Figures

Figure 1
Figure 1. Fbn1C1039G/+ mice develop marked heart failure acutely from pressure overload.
(A) Weekly temporal changes in cardiac dimensions and function after TAC. EDD, end-diastolic diameter; ESD, end-systolic diameter; FS, fractional shortening; LV mass, left ventricular mass; BL, baseline. Comparison pairs shown in brackets on right side of panels. n = 4–8 per group. (B) Representative M-mode echocardiogram 4 weeks after TAC. White arrow, end-diastolic diameter; yellow arrow, end-systolic diameter. (C) Representative whole hearts and summary results for heart weight normalized to tibia length (HW/TL) in Fbn1+/+ and Fbn1C1039G/+ mice subjected to 4 weeks of TAC. Wet lung weight (LW) was normalized to TL. n ≥ 5 per group. *P < 0.05, **P < 0.01, ***P < 0.001; ##P < 0.01 vs. Fbn1+/+:sham; ††P < 0.01 vs. Fbn1C1039G/+:sham, 2-way ANOVA, Bonferroni’s correction. (D and E) Representative hematoxylin and eosin and Masson’s trichrome staining of formalin-fixed heart sections from Fbn1+/+ and Fbn1C1039G/+ mice subjected to 4 weeks of TAC. Scale bars: 75 μm (D); 150 μm (E). White dotted line (in D) outlines myocyte circumference. Blue stain (in E) indicates fibrosis.
Figure 2
Figure 2. Fibrillin-1 protein fails to deposit in myocardium in load-induced heart failure in Fbn1C1039G/+ mice.
(A) mRNA expression of Fbn1 normalized to Gapdh and then to Fbn1+/+:sham data, assessed by real-time RT-PCR. n ≥ 4 per group. (B) Representative images of immunofluorescent fibrillin-1 staining (red) of heart sections from Fbn1+/+ and Fbn1C1039G/+ mice subjected to 4 weeks of TAC. Red, fibrillin-1 (interstitial space); blue, DAPI (nuclei); green, lipofuscin (myocytes). Scale bar: 20 μm. (C) Quantitative representation of fibrillin-1 normalized to unit area. n = 4–7 per group. (D and E) Representative Western blot and summary quantification for phosphorylated/total (p/t) Smad2 and ERK1/2 using left ventricular tissue lysates. Lanes were run on the same gel but were noncontiguous. n ≥ 4 per group. (F) mRNA expression of TGF-β targets, normalized to 18S and then to Fbn1+/+ data, assessed by real-time RT-PCR from left ventricular tissue. Col1a1, collagen type 1 a1; Fn1, fibronectin; Serpine1, plasminogen activator inhibitor, type 1; Postn, periostin; Ctgf, connective tissue growth factor; Spp1, osteopontin. n = 3–6 per group. *P < 0.05, **P < 0.01, ***P < 0.001, 1-way ANOVA, Tukey’s correction. In box-and-whisker plots, the lower and upper margins of each box define the 25th and 75th percentiles, respectively; the internal line defines the median, and the whiskers define the range. Values outside 1.5 times the interquartile distance are shown.
Figure 3
Figure 3. Smad2 and ERK1/2 activation are differentially increased in the myocyte and nonmyocyte compartments of failing Fbn1C1039G/+ hearts.
(A) Representative sections of pSmad2 (red) immunostaining. Scale bar: 20 μm. White arrowheads point to examples of positively stained myocyte nuclei. (B) Summary quantification of total intensity normalized to Fbn1+/+:sham and labeling index (percentage positive cells) of pSmad2 in the nonmyocyte and myocyte compartments. (C and D) Representative sections and summary quantification of pERK1/2 (red) immunostaining. Scale bar: 20 μm. n = 6 fields per group. **P < 0.01, ***P < 0.001, 1-way ANOVA, Tukey’s correction.
Figure 4
Figure 4. Treatment with TGF-β NAb, losartan, or MEKi improves load-induced cardiac decompensation in Fbn1C1039G/+ hearts, despite persistent load.
(A) Temporal changes of cardiac dimensions and function of Fbn1C1039G/+ hearts after TAC, with treatment arms. Fbn1+/+, blue circle with solid line; Fbn1C1039G/+, red square with solid line; Fbn1C1039G/+ with TGF-β NAb treatment, orange triangle with dotted line; Fbn1C1039G/+ with losartan (Los) treatment, green diamond with dotted line; Fbn1C1039G/+ with MEK1/2 inhibitor (MEKi) treatment, purple circle with dotted line. Early time point, 1 week after TAC; mid time point, 2–4 weeks after TAC; end time point, 3–5 weeks after TAC. EDD, end-diastolic diameter; ESD, end-systolic diameter; FS, fractional shortening; LV mass, left ventricular mass; BL, baseline. Comparison pairs shown in brackets on right side of respective panel. n ≥ 5 per group. (B) Representative M-mode echocardiograms at end time point, Fbn1C1039G/+ sham vs. TAC groups, with and without treatment. (C) Summary quantification of heart weight normalized to tibia length (HW/TL). n ≥ 5 per group. *P < 0.05, **P < 0.01, ***P < 0.001, 1-way ANOVA, Tukey’s correction.
Figure 5
Figure 5. Functional improvement of mechanically loaded Fbn1C1039G/+ hearts correlates with reduced fibrosis.
(A) Representative Masson’s trichrome–stained heart sections of Fbn1C1039G/+ sham vs. TAC groups, with and without treatment, showing fibrosis stained in blue. Scale bars: 750 μm (top); 100 μm (bottom). (B) Quantification of fibrosis, quantified by total number of blue pixels normalized to whole tissue area and then to Fbn1+/+:sham data. n = 4–7 per group. (C) mRNA expression of TGF-β–responsive fibrogenic genes, normalized to Gapdh and then to Fbn1+/+:sham data, assessed by real-time RT-PCR. Col1a1, collagen type 1 a1; Spp1, osteopontin. n = 4–6 per group. *P < 0.05, **P < 0.01, ***P < 0.001, 1-way ANOVA, Tukey’s correction. In box-and-whisker plots, the lower and upper margins of each box define the 25th and 75th percentiles, respectively; the internal line defines the median, and the whiskers define the range. Values outside 1.5 times the interquartile distance are shown.
Figure 6
Figure 6. ERK1/2 activation is upstream of Smad2 activation in Fbn1C1039G/+ hearts.
(A–D) Representative Western blot and summary quantification for Smad2 and ERK1/2 phosphorylation from left ventricular tissue lysates. n = 4–6 per group. *P < 0.05, **P < 0.01, ***P < 0.001, 1-way ANOVA, Tukey’s correction. (E) Diagram illustrating the pathogenic sequence of load-induced heart failure in the fibrillin-1–deficient myocardium of Fbn1C1039G/+ mice. NM, nonmyocytes; M, myocytes. In box-and-whisker plots, the lower and upper margins of each box define the 25th and 75th percentiles, respectively; the internal line defines the median, and the whiskers define the range. Values outside 1.5 times the interquartile distance are shown.
Figure 7
Figure 7. Inhibition of ERK1/2 activation suppresses Smad2 activation in both nonmyocyte and myocyte compartments.
Representative coimmunostaining of (A) pSmad2 (red, row 1) and vimentin (pink, row 2) and of (B) pERK1/2 (red, row 1) and vimentin (pink, row 2) of myocyte-enriched sections of Fbn1C1039G/+ hearts subjected to sham vs. TAC, with treatment groups. Scale bars: 20 μm; zoom inset: ×2 of nonmyocyte-enriched areas. Blue, DAPI (nuclei); green, lipofuscin (myocytes).
Figure 8
Figure 8. Inhibition of ERK1/2 activation suppresses expression of all three TGF-β isoforms.
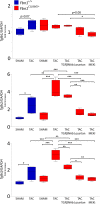
mRNA expression of Tgfb1 (TGF-β1), Tgfb2 (TGF-β2), and Tgfb3 (TGF-β3) isoforms, normalized to Gapdh and then to Fbn1+/+:sham data, assessed by real-time RT-PCR. n = 4–6 per group. *P < 0.05, **P < 0.01, ***P < 0.001, 1-way ANOVA, Tukey’s correction. In box-and-whisker plots, the lower and upper margins of each box define the 25th and 75th percentiles, respectively; the internal line defines the median, and the whiskers define the range. Values outside 1.5 times the interquartile distance are shown.

Similar articles

Cited by

References

    1. Judge DP, et al. Evidence for a critical contribution of haploinsufficiency in the complex pathogenesis of Marfan syndrome. J Clin Invest. 2004;114(2):172–181. doi: 10.1172/JCI20641. - DOI - PMC - PubMed
    1. Sisk HE, Zahka KG, Pyeritz RE. The Marfan syndrome in early childhood: analysis of 15 patients diagnosed at less than 4 years of age. Am J Cardiol. 1983;52(3):353–358. doi: 10.1016/0002-9149(83)90138-8. - DOI - PubMed
    1. Morse RP, et al. Diagnosis and management of infantile Marfan syndrome. Pediatrics. 1990;86(6):888–895. - PubMed
    1. Alpendurada F, et al. Evidence for Marfan cardiomyopathy. Eur J Heart Fail. 2010;12(10):1085–1091. doi: 10.1093/eurjhf/hfq127. - DOI - PubMed
    1. Kuwahara F, et al. Transforming growth factor-beta function blocking prevents myocardial fibrosis and diastolic dysfunction in pressure-overloaded rats. Circulation. 2002;106(1):130–135. doi: 10.1161/01.CIR.0000020689.12472.E0. - DOI - PubMed