. 2017 Aug 3;2(15):e93834.
doi: 10.1172/jci.insight.93834.

A CCR2+ myeloid cell niche required for pancreatic β cell growth

Affiliations

A CCR2+ myeloid cell niche required for pancreatic β cell growth

Kristin Mussar et al. JCI Insight. .

Abstract

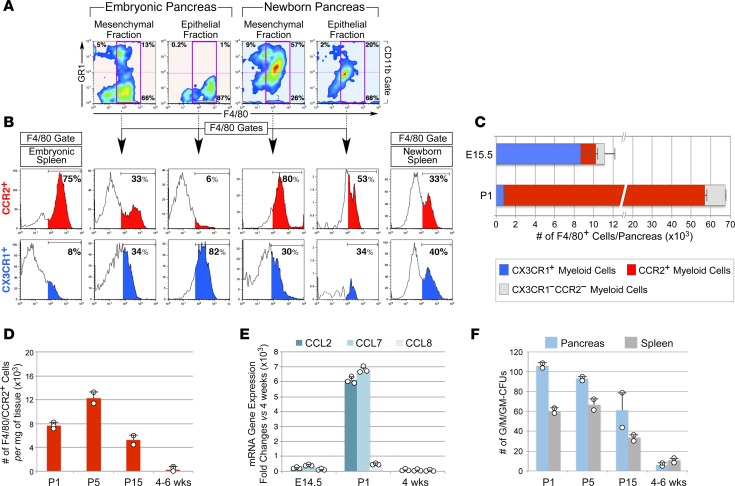
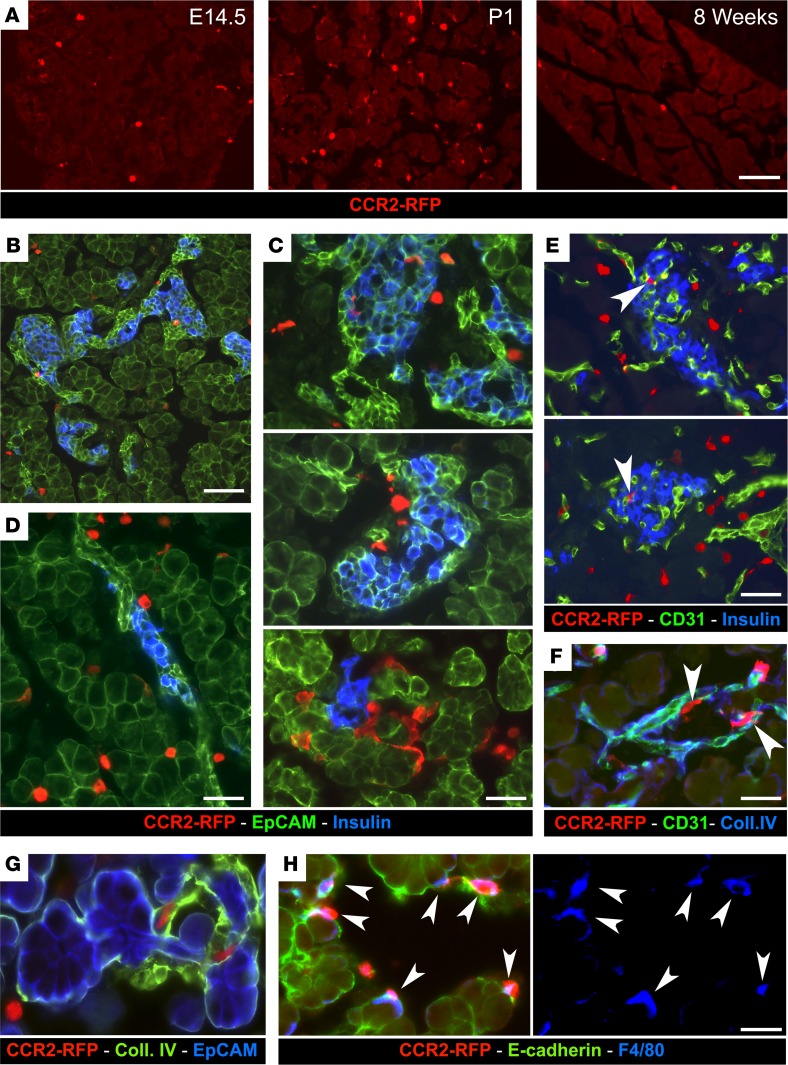
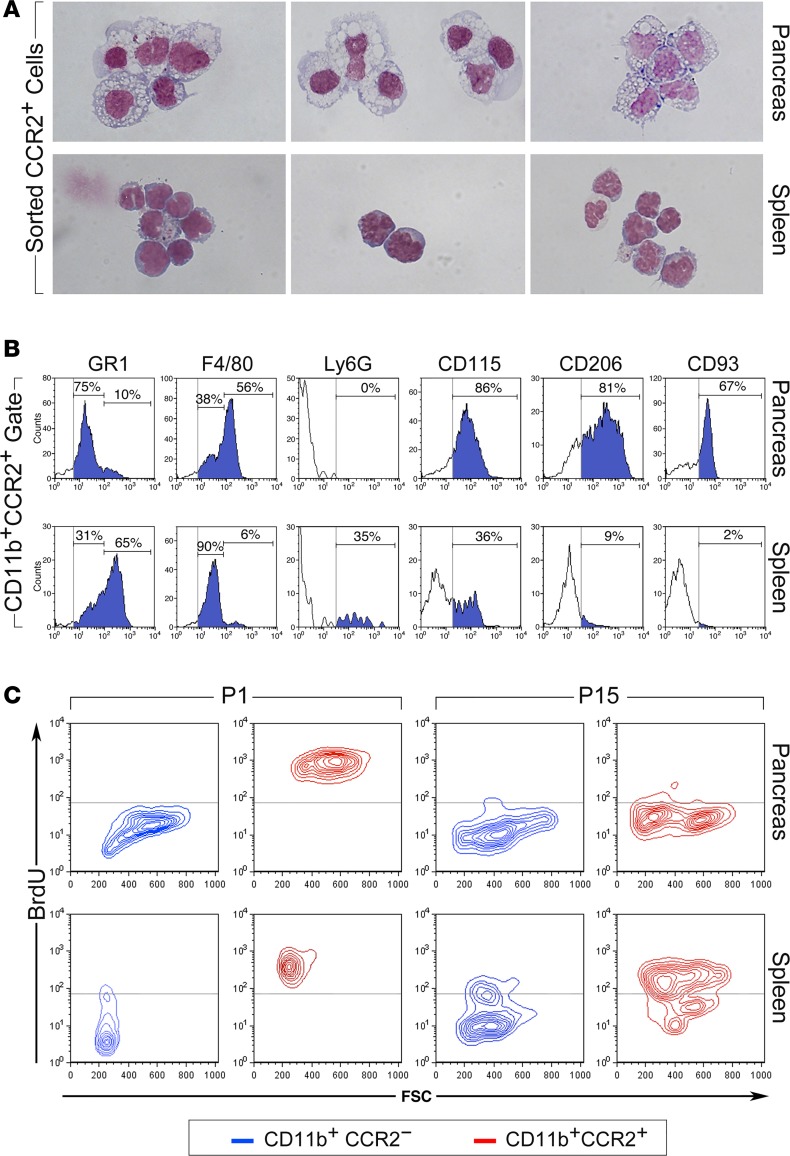
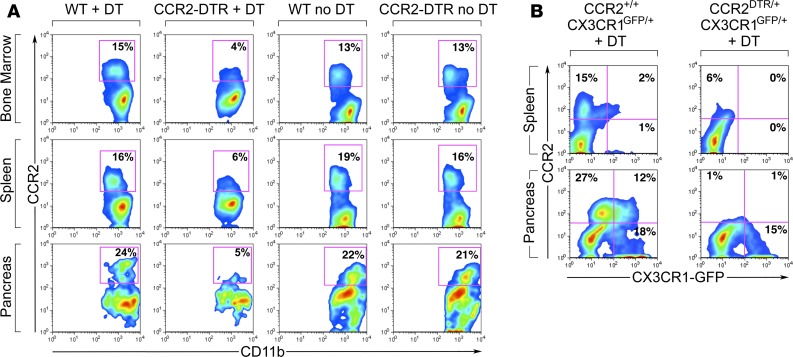
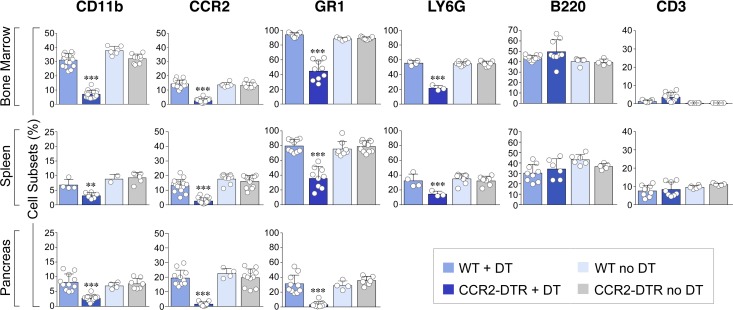
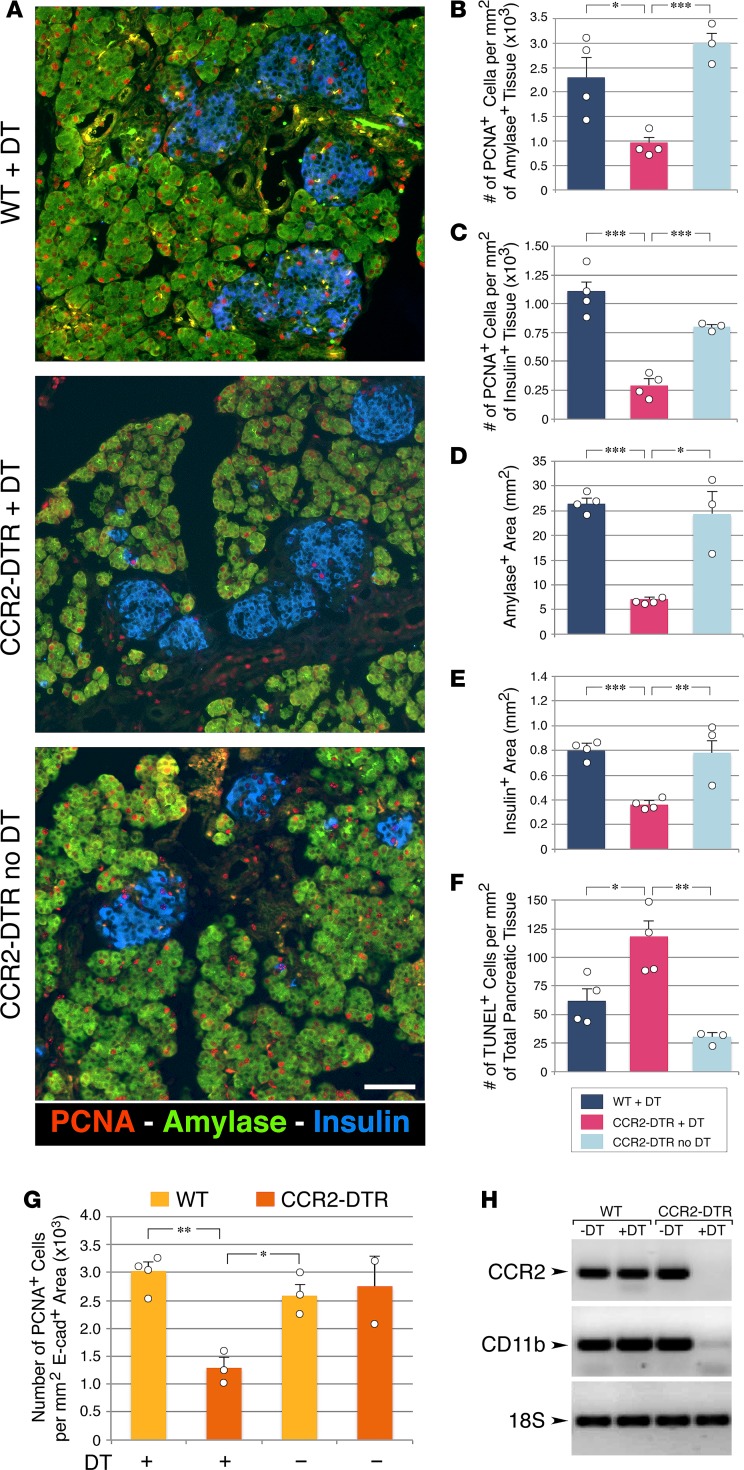
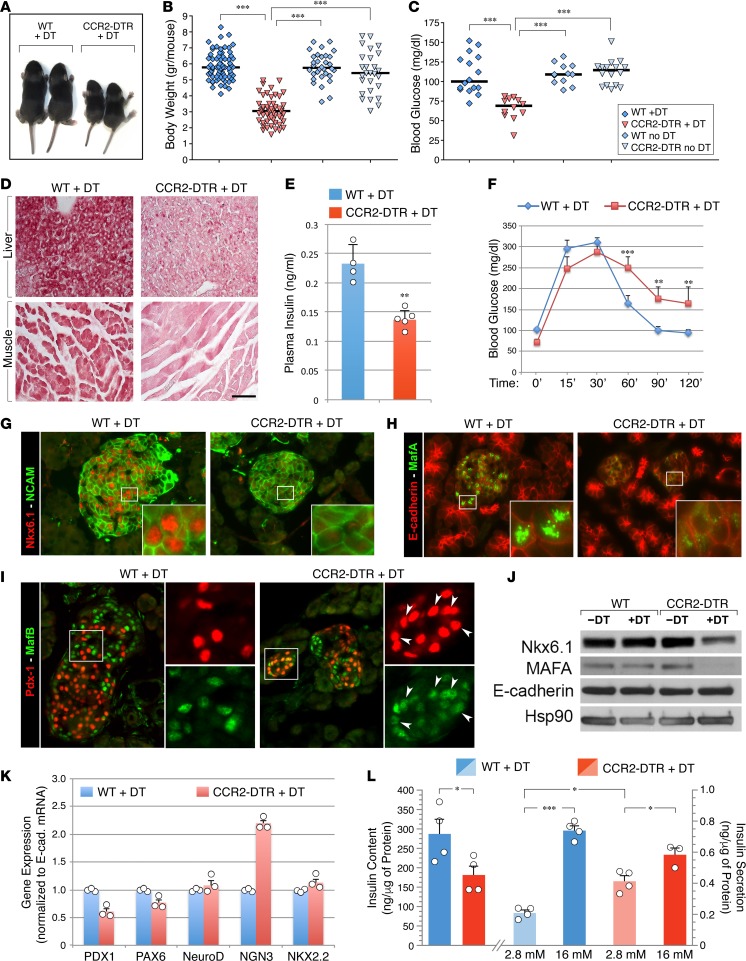
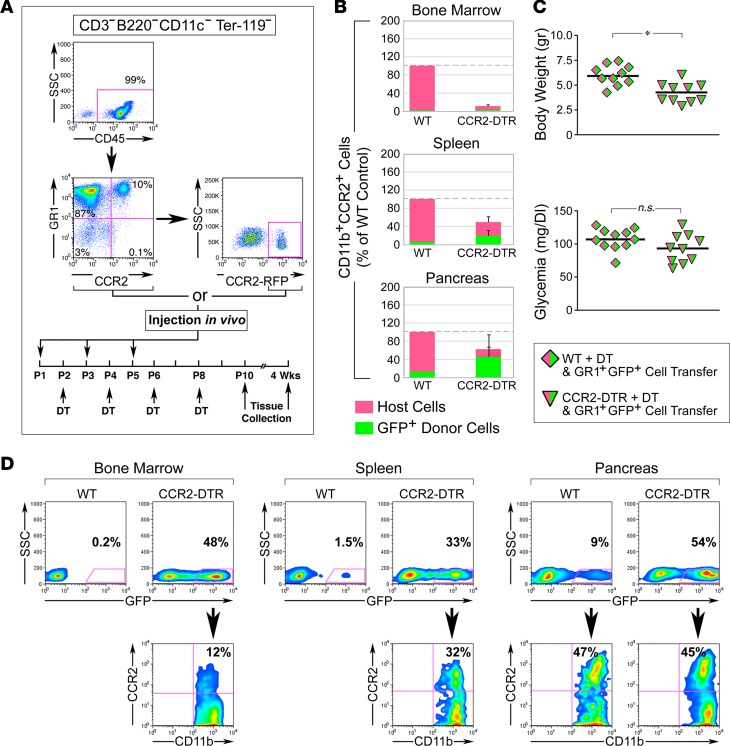
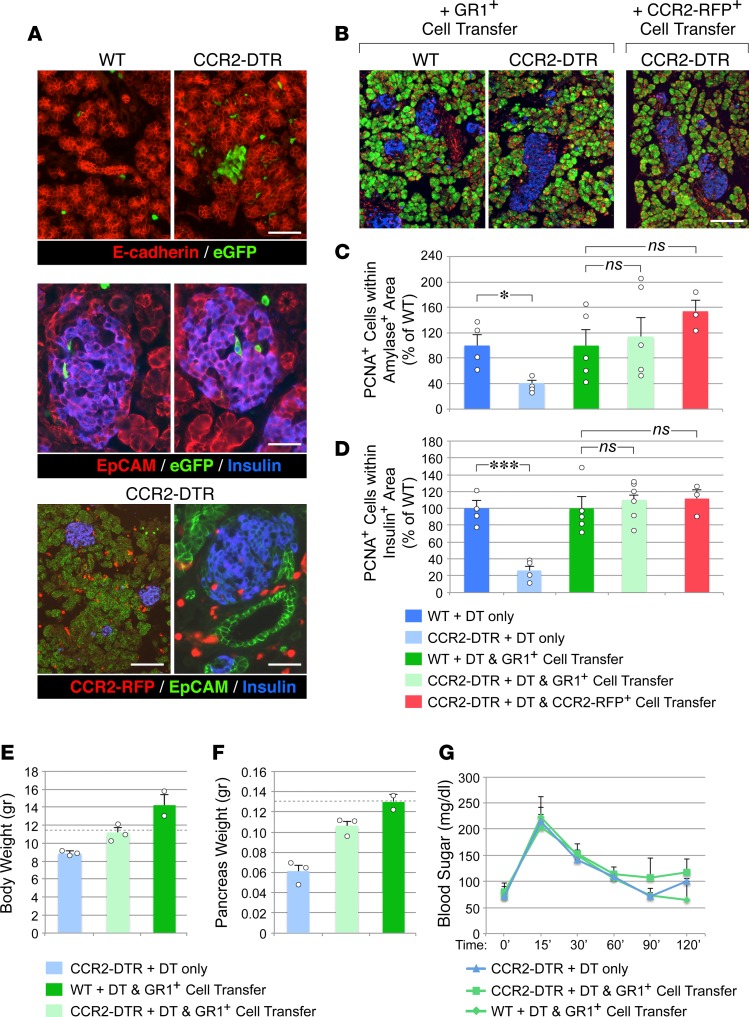
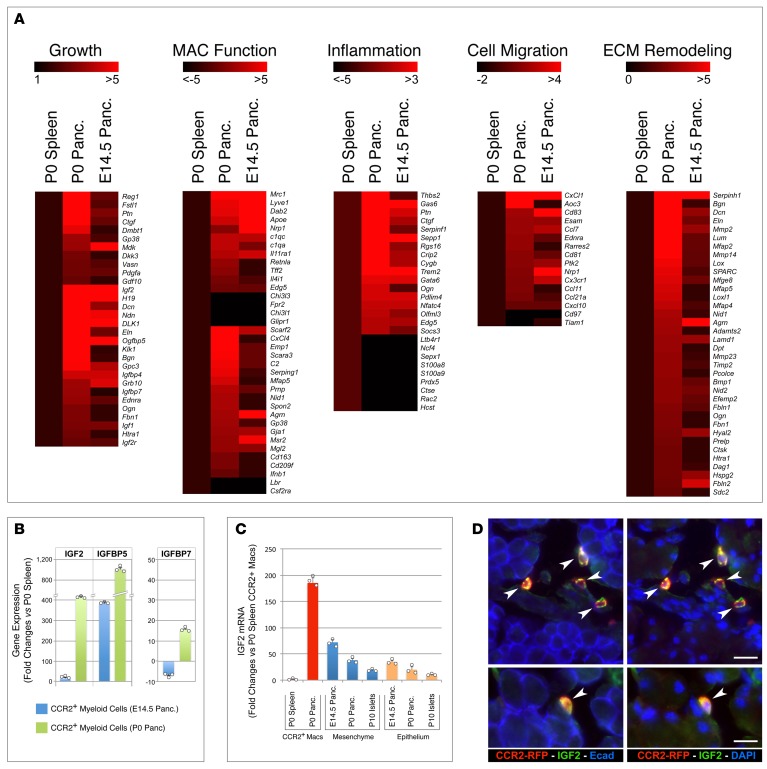
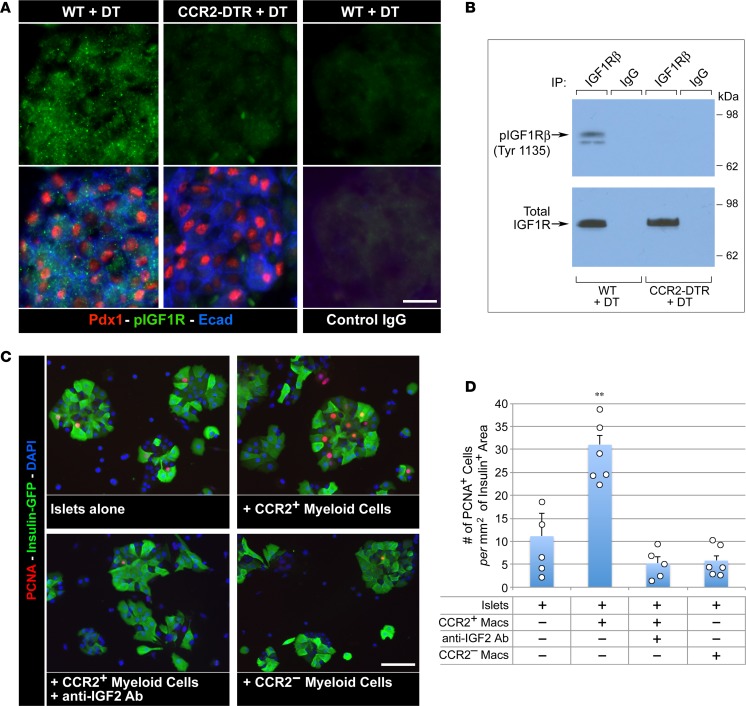
Organ-specific patterns of myeloid cells may contribute tissue-specific growth and/or regenerative potentials. The perinatal stage of pancreas development marks a time characterized by maximal proliferation of pancreatic islets, ensuring the maintenance of glucose homeostasis throughout life. Ontogenically distinct CX3CR1+ and CCR2+ macrophage populations have been reported in the adult pancreas, but their functional contribution to islet cell growth at birth remains unknown. Here, we uncovered a temporally restricted requirement for CCR2+ myeloid cells in the perinatal proliferation of the endocrine pancreatic epithelium. CCR2+ macrophages are transiently enriched over CX3CR1+ subsets in the neonatal pancreas through both local expansion and recruitment of immature precursors. Using CCR2-specific depletion models, we show that loss of this myeloid population leads to a striking reduction in β cell proliferation, dysfunctional islet phenotypes, and glucose intolerance in newborns. Replenishment of pancreatic CCR2+ myeloid compartments by adoptive transfer rescues these defects. Gene profiling identifies pancreatic CCR2+ myeloid cells as a prominent source of IGF2, which contributes to IGF1R-mediated islet proliferation. These findings uncover proproliferative functions of CCR2+ myeloid subsets and identify myeloid-dependent regulation of IGF signaling as a local cue supporting pancreatic proliferation.

Keywords: Development; Endocrinology.


Conflict of interest statement

Conflict of interest: The authors have declared that no conflict of interest exists.

Figures

Figure 1
Figure 1. Distribution and age-associated changes of myeloid subsets in distinct pancreatic tissue compartments.
(A) Flow cytometric analysis of GR1+ and F480+ subsets in mesenchymal and epithelial fractions of E15.5 and newborn pancreas (n = 3). (B) F480+ gates showing enrichment of CCR2+ macrophages in the mesenchymal fraction of newborn pancreas, whereas CX3CR1+ subsets predominate within the epithelial fraction of E15.5 pancreas. (C) Contingency plots showing the number of F480+CX3CR1+ and CCR2+ subsets detected in E15.5 and newborn pancreas (mean ± SEM of 3 tissue samples). (D) Age-associated changes in the frequency of pancreatic F480+CCR2+ cells (mean ± SD of at least 2 tissue pools per time point). (E) qPCR of chemokine transcripts in mesenchymal fractions of E14.5, P1, and 4-week-old pancreas (mean ± SD of triplicates) (n = 2, using pools of 3–5 tissues per time point). (F) Myeloid CFU outgrowth from 100,000 cells/tissue (mean ± SD of n = 2 tissue pools, each run in duplicate cultures).
Figure 2
Figure 2. Localization of CCR2+ myeloid cells in the pancreas.
(A) Pancreatic sections from E14.5, P1, and adult CCR2WT/RFP mice, stained for RFP to visualize CCR2+ cells in situ. (B–D) Pancreatic sections from P1 CCR2WT/RFP mice stained for RFP, insulin, and the epithelial marker EpCAM. (E–H) The same tissue sections stained for RFP, insulin, and the vascular markers CD31 (E) and collagen IV (F and G), or the epithelial marker E-cadherin and the macrophage marker F480 (H). CCR2RFP+ cells occupy the interacinar and peri-islet interstitial space (B–D), outline the extraluminal side of blood vessels (E and F, arrowheads), or line Ep-CAM+ and E-cadherin+ epithelial clusters (G and H, arrowheads). Most CCR2+ cells coexpress F480 (H, arrowheads). Scale bars: 50 μm (A); 40 μm (B); 25 μm (C–F); and 20 μm (G and H). Representative of n = 10 experiments.
Figure 3
Figure 3. Phenotype of CCR2+ myeloid subsets.
(A) Morphology of CD11b+CCR2+ myeloid cells sorted from spleen and pancreas of P1 WT mice stained by Wright-Giemsa (n = 3). (B) Flow cytometric analysis of pancreatic and splenic CCR2+ cells for myeloid cell markers. Vertical gray lines mark background fluorescence of IgG controls. Representative of n = 4 experiments. (C) Flow cytometric plots showing the fraction of BrdU+ cells detected in pancreatic and splenic CD11b+CCR2+ and CD11b+CCR2 subsets from P1 and P15 newborns after a 16 hours pulse in vivo (n = 4, using pools of 3–4 tissue samples).
Figure 4
Figure 4. Quantitative analysis of leukocyte subsets in BM, splenic, and pancreatic tissue compartments of CCR2DTR/+ and WT mice treated with diphtheria toxin.
(A) Flow cytometric analysis of CD11b+CCR2+ subsets obtained from BM, spleen, and pancreas of P10 mice, showing depletion of CCR2+ cells in all tissue compartments of diphtheria toxin–treated (DT-treated) CCR2DTR/+ mice, as compared with controls. (B) Same analysis in DT-treated CCR2DTR/+CX3CR1GFP/+ mice and CCR2+/+CX3CR1GFP/+ controls at P10, showing persistence of CCR2CX3CR1+ macrophages. Representative of n = 4 experiments.
Figure 5
Figure 5. Cumulative flow cytometric analysis of leukocyte subsets in the indicated tissue compartments.
CCR2+, GR1+, and LY6G+ cells were gated within the CD11b+ subset. Diphtheria toxin (DT) treatment effectively depletes CD11b+CCR2+ cells and partially affects GR1+ and LY6G+ subsets but not B220+ (B cells) and CD3+ (T/NK) cells (mean ± SEM of n = 6–17 determinations per group). **P < 0.01, ***P < 0.001, 1-way ANOVA nonparametric test, followed by Bonferroni post-hoc test.
Figure 6
Figure 6. Effects of CCR2+ cell depletion on the proliferation of the exocrine and endocrine compartments of the pancreas.
(A) Pancreatic sections of diphtheria toxin–treated (DT-treated) P10 mice stained for amylase, insulin and the proliferation marker PCNA. Scale bar: 50 μm. Representative of at least n = 4 per group. (B and C) Frequency of PCNA+ cells detected within amylase+ (B) and insulin+ (C) areas. (D and E) Morphometric analysis of amylase+ and insulin+ areas. (F) Frequency of TUNEL+ apoptotic cells in pancreatic epithelial tissue identified by E-cadherin staining. (BF) Mean ± SEM of n = 3–4 mice per group. (G) Frequency of proliferating epithelial cells in P2 pancreatic explants from CCR2DTR/+ mice and WT littermates after culture in the presence or absence of DT (n = 2–4 experiments using pools of 3–4 pancreata). (H) PCR analysis of CCR2 and CD11b mRNA transcripts in organ cultures shown in G, validating the depletion of CCR2+ cells in DT-treated CCR2DTR/+ tissues. Mean + SD. Representative of n = 2–4 experiments. *P < 0.05, **P < 0.01, ***P < 0.001, 1-way ANOVA nonparametric test, followed by Bonferroni post-hoc test.
Figure 7
Figure 7. Effects of CCR2+ cell depletion on body size and glycemic homeostatic control.
(A) Decreased body size of DT-treated CCR2DTR/+ mice compared with WT littermates at P10. (B) Body weight of untreated or DT-treated CCR2DTR/+ mice and WT littermates at P10 (n = 27–71). (C) Mild basal hypoglycemia detected in DT-treated CCR2DTR/+ mice at P10 (n = 9–16). (D) Tissue sections of liver and skeletal muscle stained by periodic acid–Schiff, showing decreased glycogen storages in DT-treated CCR2DTR/+ P10 pups. Scale bar: 50 μm. Representative of n = 4. (E and F) Basal plasma insulin (E) (n = 4–5) and glucose tolerance tests (F) (n = 7–9) in P10 DT-treated CCR2DTR/+ mice and WT littermates. **P < 0.01, ***P < 0.001, 1-way ANOVA nonparametric test, followed by Bonferroni post-hoc test. (GI) Pancreatic sections from P10 DT-treated WT and CCR2DTR/+ mice stained for the islet markers NCAM and NKX6.1 (G); islet transcription factor MafA and E-cadherin (H); and islet transcription factors PDX1 and MafB (I). Insets in G and H show NKX6.1 and MafA localization to the islets’ nuclei, whereas insets in I show aberrant persistence of MafB in PDX+ cells in DT-treated CCR2DTR/+ mice (arrowheads). Representative of at least n = 6 per group. (J) Western blotting of NKX6.1 and MafA expressed in total protein lysates of P10 pancreatic islets. Membranes were stripped and reprobed for E-cadherin and Hsp90 as loading controls (n = 3). (K) Representative qPCR analysis of islet transcription factors mRNAs in pancreatic islets of DT-treated WT and CCR2DTR/+ mice at P10 (n = 2) (mean ± SD of triplicates). (L) Insulin content and glucose-stimulated insulin secretion of islets isolated from DT-treated WT and CCR2DTR/+ mice at P10 (n = 3–4). *P < 0.05, ***P < 0.001 by 2-tailed Student’s t test used for insulin content and by 1-way ANOVA nonparametric test for multiple comparisons of insulin secretion.
Figure 8
Figure 8. Adoptive transfer of DT-resistant CCR2+ cells reconstitutes the pancreatic CCR2+ myeloid pool.
(A) FACS analysis of myeloid populations used for adoptive transfer, and time line of cell and DT injections. Adoptively transferred populations were GR1+ CD3B220CD11cTer119 cells isolated from BM of C57BL/6-Tg(CAG-EGFP)10sb/J or CCR2WT/RFP reporter mice, purified to >97% by negative selection, or CCR2-RFP+ cells FACS sorted from GR1+ cells based on RFP expression in the depicted gate. (B) Contingency plots showing the relative representation of host- and donor-derived CD11b+CCR2+ myeloid cells in BM, spleen, and pancreas after reconstitution of DT-treated WT and CCR2DTR/+ mice with DT-resistant GR1+GFP+ cells (mean ± SEM of n = 3–6 tissue samples per group and tissue type). (C) Body weight and basal glycemia in P10 WT and CCR2DTR/+ mice treated with DT and simultaneously rescued with DT-resistant GR1+GFP+ cells. *P < 0.05, unpaired t test. (D) Flow cytometry plots of BM and splenic and pancreatic CD11b+ myeloid cells from DT-treated CCR2DTR/+ WT mice (P10) reconstituted with DT-resistant GR1+GFP+ cells. Gating on GFP+ cells (bottom row) demonstrates a substantial fraction of CCR2+ cells of donor origin in the pancreas. Representative of n = 3 experiments.
Figure 9
Figure 9. Reconstitution of CCR2+ myeloid pools by DT-resistant CCR2+ cells rescues pancreatic epithelial proliferation.
(A) Pancreatic sections from DT-treated mice reconstituted with GFP+GR1+ cells, stained for E-cadherin or EpCAM (red), insulin (blue), and GFP (green). GFP+ cells populate epithelial exocrine and endocrine clusters. Pancreatic sections from DT-treated CCR2DTR/+ mice reconstituted with CCR2+ cells from CCR2WT/RFP mice showing CCR2-RFP+ cells (red) throughout the pancreas, including islet structures, identified by EpCAM (green) and insulin (blue) immunoreactivity, respectively. Representative of n = 6 experiments. (B) Pancreatic sections of P10 DT-treated mice rescued with GR1+ cells or sorted CCR2-RFP+ cells, stained for PCNA (red), amylase (green), and insulin (blue). Representative of n = 3 experiments. Scale bars: 50 μm (A); 100 μm (B). (C and D) Morphometric analysis of proliferating PCNA+ cells detected within amylase+ (C) and insulin+ (D) areas (mean ± SEM of 3–5 mice per group). *P < 0.05, ***P < 0.001, 1-way ANOVA nonparametric test, followed by Bonferroni post-hoc test. (E and F) Body and pancreatic weights of rescued and not rescued CCR2DTR/+ mice and controls, followed up to 4 weeks of age (mean ± SEM of 2–3 mice per group; dashed lines represent average body and pancreas weights of untreated age-matched WT controls). (G) Glucose tolerance tests of the mice in E and F after 16 hours of fasting, showing normal glucose tolerance.
Figure 10
Figure 10. Transcriptional profiling of CCR2+ myeloid subsets.
(A) Heatmaps of select genes differentially expressed in CD11b+CCR2+ myeloid cells sorted from P0 and E14.5 pancreas as compared with those sorted from P0 spleen, as reference. Scales on top of each gene cluster show the range of changes (bright red = highest; black = lowest). (B) Validation of differentially expressed IGF-related transcripts by RT-PCR. (C) RT-PCR of IGF2 mRNA detected in sorted CCR2+ myeloid cells isolated from P0 spleen and pancreas (red bars) versus that measured in whole mesenchymal and epithelial fractions of E14.5 and P0 pancreas or CD45CD31EpCAM+ cells sorted from P10 islets (mean ± SEM of triplicate samples normalized to 18S). Representative of n = 2. (D) IGF2 immunoreactivity in pancreatic sections of P10 CCR2RFP/WT mice highlights CCR2+RFP+ cells (arrowheads). Scale bars: 30 μm (top row) and 20 μm (bottom row). Representative of n = 3 experiments.
Figure 11
Figure 11. CCR2+ myeloid cells positively modulate IGF signaling in the pancreas.
(A) Pancreatic sections of DT-treated WT and CCR2DTR/+ P10 mice stained for PDX1, pospho-IGF1Rβ, and E-cadherin or control IgGs. Note the diminished pospho-IGF1R-specific immunoreactivity in CCR2-depleted pancreas. (B) Western blot analysis of phosphorylated and total IGF1Rβ in whole pancreatic cell lysates from DT-treated WT and CCR2DTR/WT P10 mice. Representative of n = 3 experiments. (C and D) Immunostaining and morphometric analysis of proliferating PCNA+ β cells in the indicated islets/myeloid cells cocultures. CCR2+ and CCR2 myeloid cells used in these cultures were obtained by cell sorting from P1 pancreas (mean ± SEM of 5 microscopic fields, n = 2). **P < 0.01, ANOVA followed by Kruskal-Wallis post-hoc test. Scale bars: 20 μm.

Similar articles

Cited by

References

    1. Pollard JW. Trophic macrophages in development and disease. Nat Rev Immunol. 2009;9(4):259–270. doi: 10.1038/nri2528. - DOI - PMC - PubMed
    1. Wiktor-Jedrzejczak W, et al. Correction by CSF-1 of defects in the osteopetrotic op/op mouse suggests local, developmental, and humoral requirements for this growth factor. Exp Hematol. 1991;19(10):1049–1054. - PubMed
    1. Abe S, et al. Cells derived from the circulation contribute to the repair of lung injury. Am J Respir Crit Care Med. 2004;170(11):1158–1163. doi: 10.1164/rccm.200307-908OC. - DOI - PubMed
    1. Aurora AB, et al. Macrophages are required for neonatal heart regeneration. J Clin Invest. 2014;124(3):1382–1392. doi: 10.1172/JCI72181. - DOI - PMC - PubMed
    1. Boulter L, et al. Macrophage-derived Wnt opposes Notch signaling to specify hepatic progenitor cell fate in chronic liver disease. Nat Med. 2012;18(4):572–579. doi: 10.1038/nm.2667. - DOI - PMC - PubMed