. 2017 Aug 3;2(15):e93434.
doi: 10.1172/jci.insight.93434.

Dichotomous miR expression and immune responses following primary blood-stage malaria

Affiliations

Dichotomous miR expression and immune responses following primary blood-stage malaria

Julie G Burel et al. JCI Insight. .

Abstract

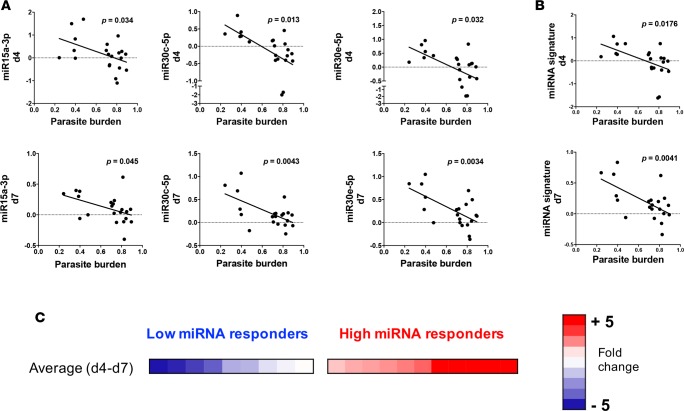
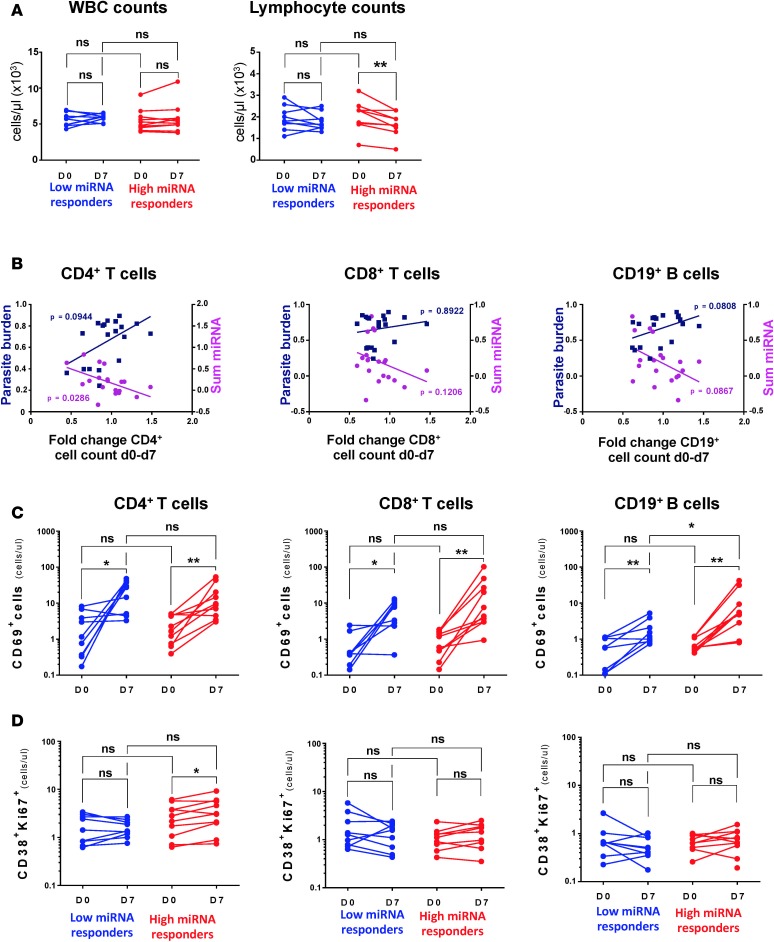
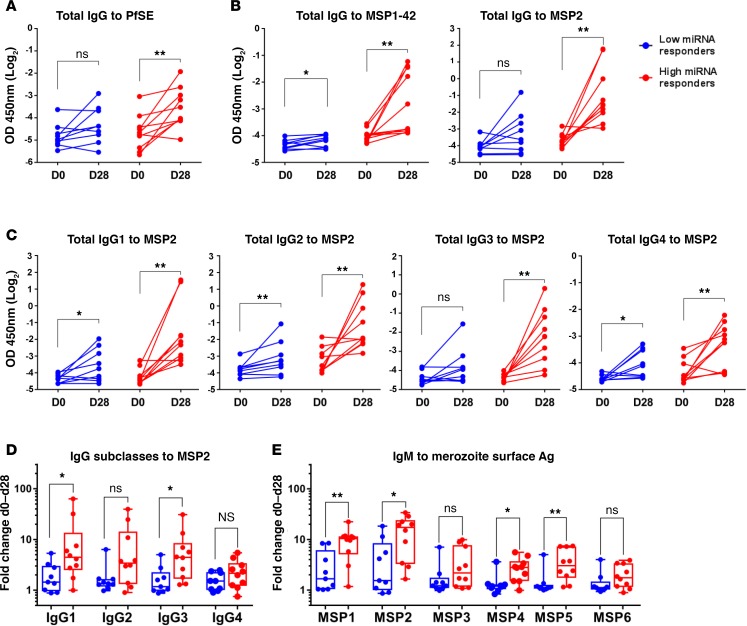
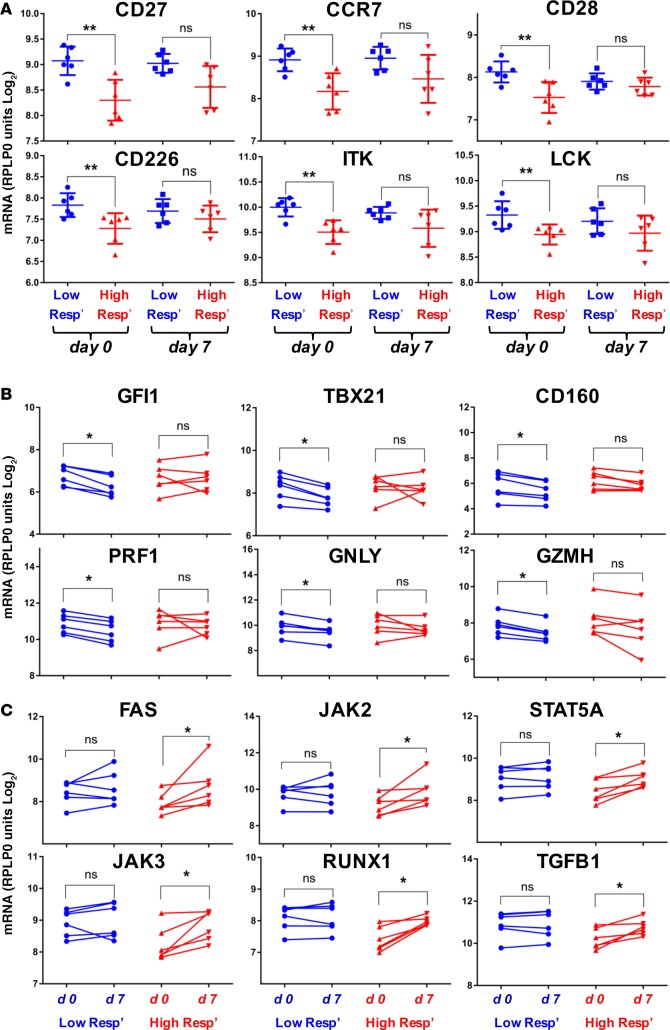
Clinical responses to infection or vaccination and the development of effective immunity are characterized in humans by a marked interindividual variability. To gain an insight into the factors affecting this variability, we used a controlled human infection system to study early immune events following primary infection of healthy human volunteers with blood-stage Plasmodium falciparum malaria. By day 4 of infection, a dichotomous pattern of high or low expression of a defined set of microRNAs (miRs) emerged in volunteers that correlated with variation in parasite growth rate. Moreover, high-miR responders had higher numbers of activated CD4+ T cells, and developed significantly enhanced antimalarial antibody responses. Notably, a set of 17 miRs was identified in the whole blood of low-miR responders prior to infection that differentiated them from high-miR responders. These data implicate preexisting host factors as major determinants in the ability to effectively respond to primary malaria infection.

Keywords: Immunology; Infectious disease.


Conflict of interest statement

Conflict of interest: The authors have declared that no conflict of interest exists.

Figures

Figure 1
Figure 1. Whole-blood miR expression profile in malaria-naive human volunteers experimentally infected with blood-stage P. falciparum.
Whole blood was collected prior to, and on days 4 and 7 of infection in PAXgene blood RNA tubes. Relative quantification of 71 miRs involved in T cell and B cell activation detected at day 4 (d4) and day 7 (d7) of infection (compared to day 0) was determined by RT-qPCR using human T cell and B cell activation miScript miRNA PCR arrays (Qiagen) and the ddCt method. (A) Heatmaps representing the fold change in miR expression at d4 and d7 of infection relative to d0 for each miR across 14 volunteers from 3 independent cohorts. miRs were sorted according to their order within the miScript PCR array layout. (B) Correlation for each volunteer between the sum of fold changes for each of the 71 miRs’ expression at d4 or d7 after infection (relative to d0), determined using Pearson’s correlation test.
Figure 2
Figure 2. Expression of miR15a-3p, miR30c-5p, and miR30e-5p during P. falciparum blood-stage infection inversely correlates with parasite burden.
Whole blood was collected prior to, and on days 4 and 7 of infection into PAXgene blood RNA tubes. Relative quantification of miR15a-3p, miR30c-5p, and miR30e-5p at day 4 (d4) and day 7 (d7) of infection (compared with day 0) was determined by RT-qPCR using Taqman microRNA assays and the ddCt method. Total parasite burden during the first 7 days of infection was defined as the AUC of the log-transformed parasite levels measured using a consensus P. falciparum qPCR assay from day 0 to day 7 of infection. Correlation between parasite burden and the relative average expression of miR15a-3p, miR30c-5p, and miR30e5p (A) at day 4 or day 7 of infection or (B) the average of fold changes for miR15a-3p, miR30c-5p, and miR30e-5p (miR signature). Parasite burden and miR expression datasets were log transformed for graphic representation and linear regression analysis. (C) Volunteers were classified as low-miR responders (n = 9 volunteers, average fold change ≤ 1) or high-miR responders (n = 11 volunteers, average fold change ≥ 1.5) according to the combined relative expression of miR15a-3p, miR30c-5p, and miR30e-5p at day 4 and day 7 of infection. One volunteer whose overall fold change was between 1 and 1.5 was not classified as a high- or low-miR responder, and was therefore excluded. Graphs show data from 21 volunteers (each depicted as a colored square across the x axis) from 4 independent cohorts.
Figure 3
Figure 3. Increased CD4+ T cell responses in high-miR responders between day 0 and day 7 of infection.
Whole blood was collected prior to (d0), and on day 7 of infection (d7) from individuals classified as low-miR responders (n = 9) or high-miR responders (n = 11) as detailed in Figure 2C. (A) White blood cell (WBC) and lymphocyte counts determined on the day of collection by automated cell counter. (B) Correlation of CD4+, CD8+, and CD19+ cell counts in peripheral blood (determined by flow cytometry) and parasite burden over first 7 days of infection (left axis, square symbols), or the average (Avg) of fold changes (FC) for miR15a-3p, miR30c-5p, and miR30e-5p from d0 to d7 of infection (average miR, right axis, round symbols) (Spearman’s correlation). The number of CD4+, CD8+, and CD19+ cells expressing CD69 (C), or coexpressing Ki67 and CD38 was determined directly ex vivo from whole-blood samples by flow cytometry. In A, C, and D the differences between D0 and D7 in low-miR responders or high-miR responders were determined using the nonparametric paired Wilcoxon test; the comparison between the high- and low-responder groups on D0 or on D7 was determined using nonparametric Mann-Whitney test. *P < 0.05; **P < 0.01. Graphs show the data for 20 volunteers from 4 independent cohorts. ns, not significant.
Figure 4
Figure 4. The anti-Plasmodium antibody response is more robust in high-miR responders.
IgG antibody titers specific to (A) P. falciparum schizont extract (PfSE) or (B) MSP1-42 (42-kDa fragment of merozoite surface 1 [MSP1]) and MSP2 P. falciparum proteins were determined using an ELISA assay in plasma samples collected prior to infection and 28 ± 3 days after the day of infection. (C) IgG subclass responses (IgG1, IgG2, IgG3, and IgG4) were determined for MSP2. (D) Fold-change induction between d0 and d28 in antibody titers was calculated for each subclass against MSP2 and was compared between low- and high-miR responders. (E) IgM fold-change induction between d0 and d28 in response to MSP1, MSP2, MSP3, MSP4, MSP5, and MSP6 was compared between low- and high-miR responders. Data were assessed for significance by nonparametric paired Wilcoxon test (AC) or nonparametric Mann-Whitney test (D and E). Box-and-whisker plots: boxes show 25th to 75th percentiles, whiskers extend to all data, line within box shows median; low-miR responders n = 9, high-miR responders n = 10. *P < 0.05; **P < 0.01. ns, not significant.
Figure 5
Figure 5. mRNA expression defines low- and high-miR responder groups prior to and during infection.
mRNA expression in whole blood was determined for a set of 135 genes using NanoString in 12 volunteers taken prior to (d0), and on day 7 (d7) of infection the from high- and low-miR responder groups. (A) The top 6 differentially expressed genes between the low- and high-miR responders groups by P value (Mann-Whitney test, mean and SD are indicated). Paired analysis of changes in mRNA expression for individuals between d0 and d7 of infection (Wilcoxon test), (B) the top 6 regulated genes for the low-miR responders and (C) for the high-miR responders (by P value). *P < 0.05; **P < 0.01. ns, not significant.
Figure 6
Figure 6. Strong positive correlations are evident for circulating miRs and mRNAs prior to infection.
Expression levels of our 3-miR signature (miR15a-3p [green], miR30c-5p [blue], and miR30e-5p [pink]) and the set of mRNAs shown to be significantly regulated between the high- and low-miR responder groups prior to infection (above in Figure 5) were correlated at day 0 (d0) and d7 (Spearman correlation, 6 volunteers from each of the high- and low-responder groups). Graphical representation of correlations of 3 selected mRNAs predicted as targets for the 3-miR signature are shown. *P < 0.05; **P < 0.01. ns, not significant.

References

    1. WHO. World Malaria Report 2015. Geneva, Switzerland: WHO; 2015. http://www.who.int/malaria/publications/world-malaria-report-2015/report... Accessed July 13, 2017.
    1. Comstock GW, Livesay VT, Woolpert SF. The prognosis of a positive tuberculin reaction in childhood and adolescence. Am J Epidemiol. 1974;99(2):131–138. doi: 10.1093/oxfordjournals.aje.a121593. - DOI - PubMed
    1. Dye C, Floyd K. Tuberculosis. In: Jamison DT, et al., eds. Disease Control Priorities in Developing Countries. Washington, DC, USA: World Bank Publications; 2006:Chapter 16.
    1. Taubenberger JK, Morens DM. 1918 Influenza: the mother of all pandemics. Emerging Infect Dis. 2006;12(1):15–22. doi: 10.3201/eid1209.05-0979. - DOI - PMC - PubMed
    1. Garnham PCC. Charles Nicolle and inapparent infections. Am J Trop Med Hyg. 1977;26:1101–1104. doi: 10.4269/ajtmh.1977.26.1101. - DOI