. 2017 Aug 2;7(1):7159.
doi: 10.1038/s41598-017-07658-y.

Connexin 43 is required for the maintenance of mitochondrial integrity in brown adipose tissue

Affiliations

Connexin 43 is required for the maintenance of mitochondrial integrity in brown adipose tissue

Sang-Nam Kim et al. Sci Rep. .

Abstract

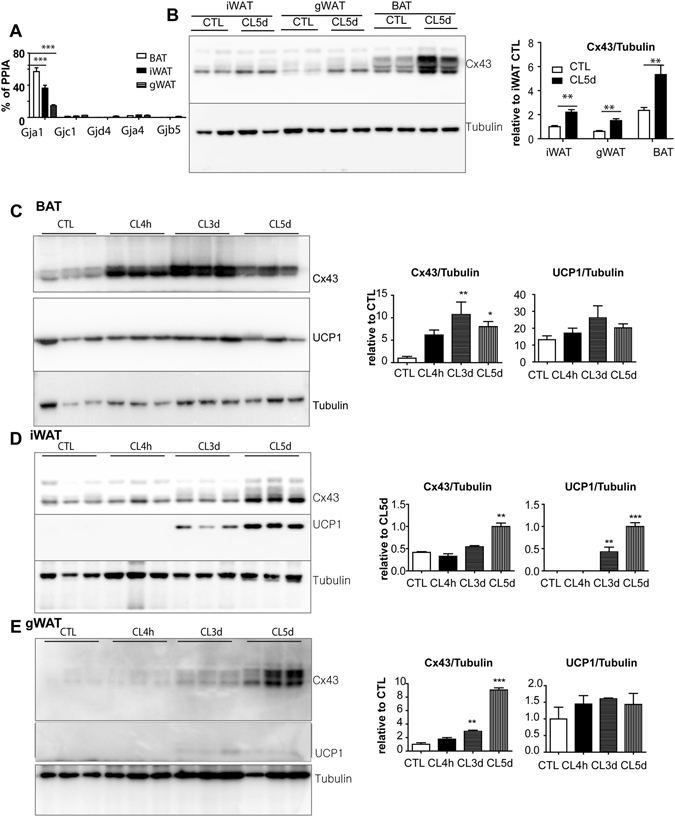
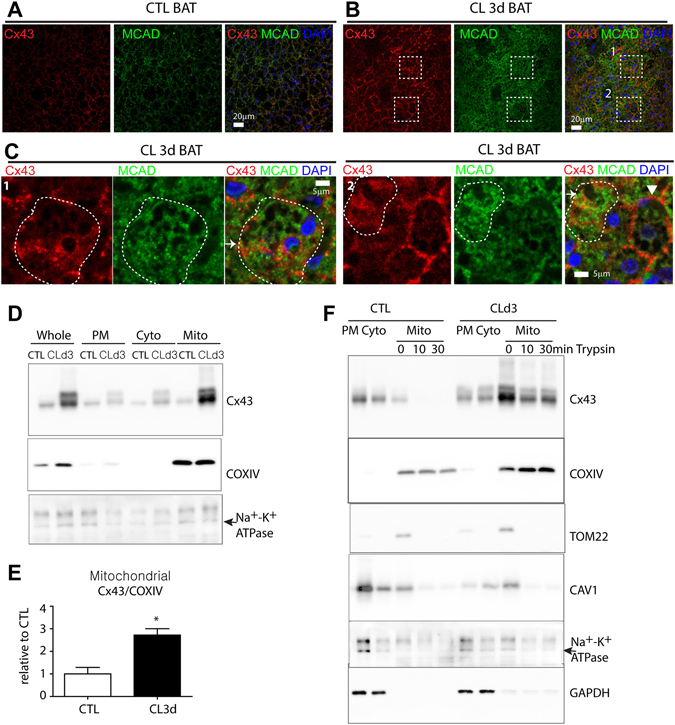
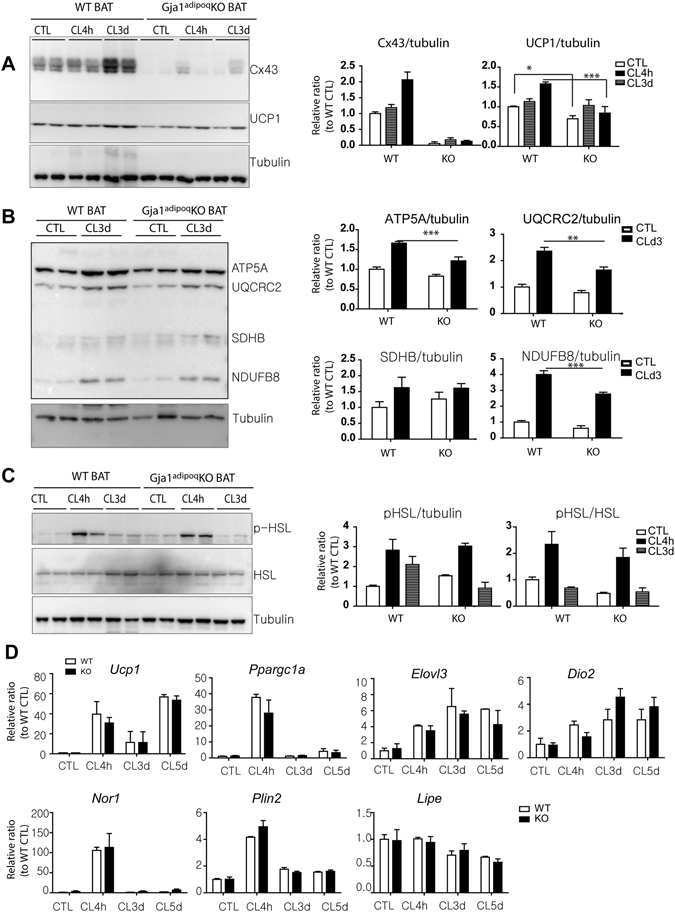
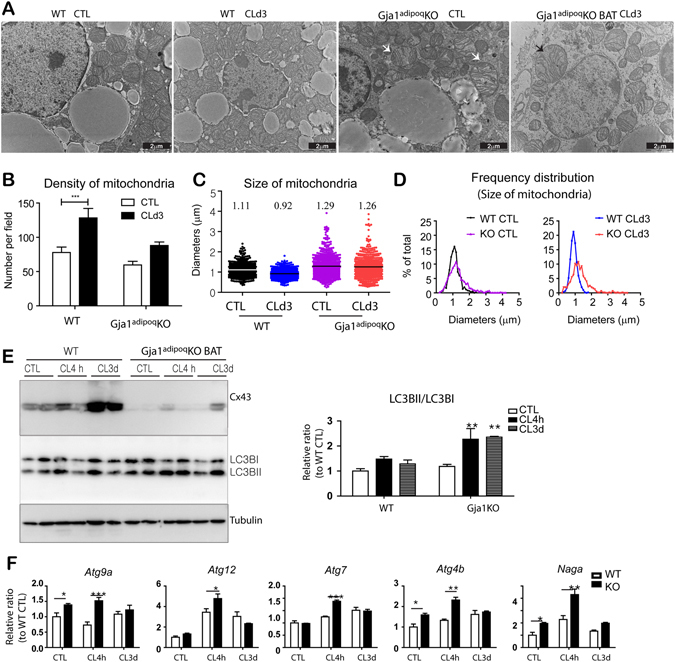
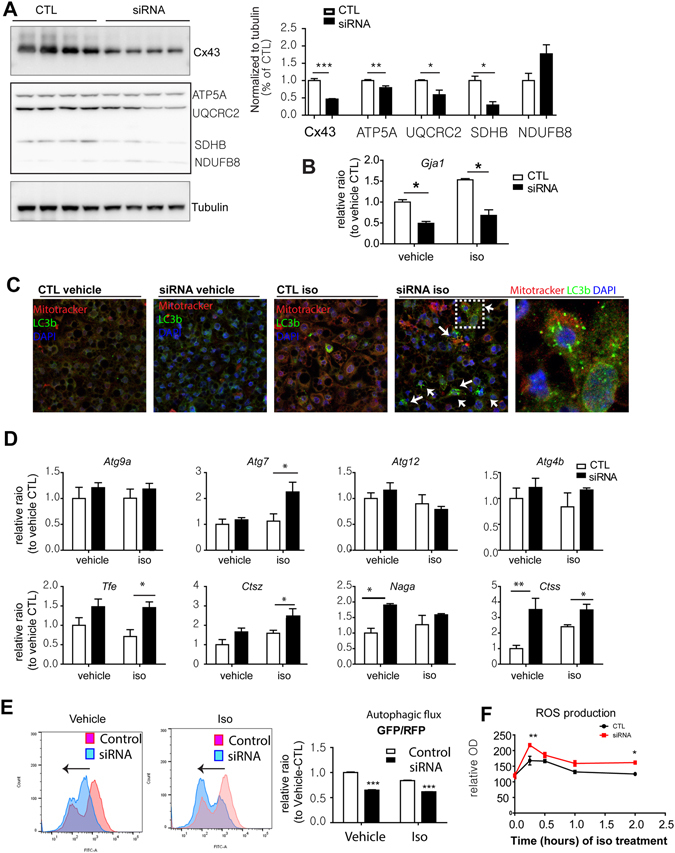
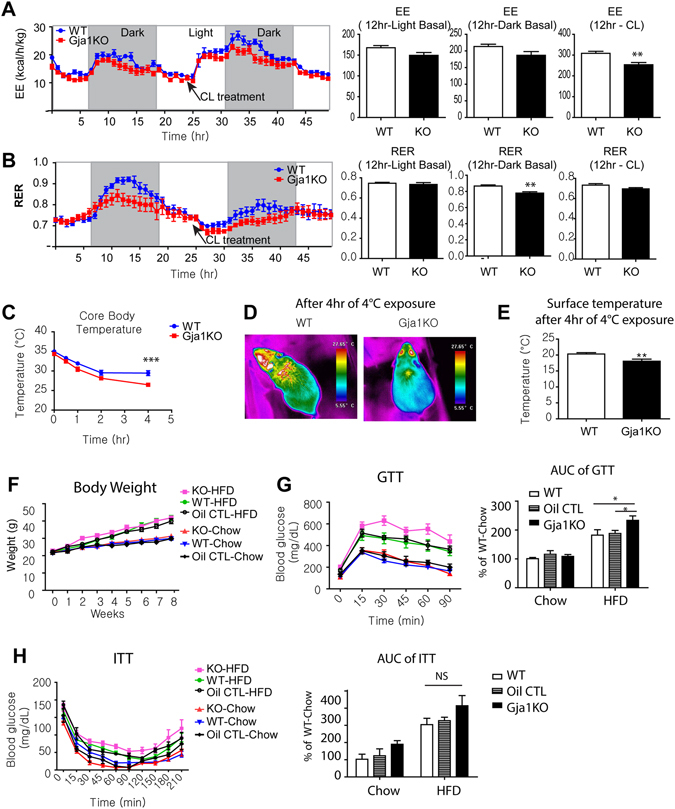
We investigated the role of connexin 43 (Cx43) in maintaining the integrity of mitochondria in brown adipose tissue (BAT). The functional effects of Cx43 were evaluated using inducible, adipocyte-specific Cx43 knockout in mice (Gja1 adipoq KO) and by overexpression and knockdown of Cx43 in cultured adipocytes. Mitochondrial morphology was evaluated by electron microscopy and mitochondrial function and autophagy were assessed by immunoblotting, immunohistochemistry, and qPCR. The metabolic effects of adipocyte-specific knockout of Cx43 were assessed during cold stress and following high fat diet feeding. Cx43 expression was higher in BAT compared to white adipose tissue. Treatment with the β3-adrenergic receptor agonist CL316,243 increased Cx43 expression and mitochondrial localization. Gja1 adipoq KO mice reduced mitochondrial density and increased the presence of damaged mitochondria in BAT. Moreover, metabolic activation with CL316,243 further reduced mitochondrial integrity and upregulated autophagy in the BAT of Gja1 adipoq KO mice. Inhibition of Cx43 in cultured adipocytes increased the generation of reactive oxygen species and induction of autophagy during β-adrenergic stimulation. Gja1 adipoq KO mice were cold intolerant, expended less energy in response to β3-adrenergic receptor activation, and were more insulin resistant after a high-fat diet challenge. Collectively, our data demonstrate that Cx43 is required for maintaining the mitochondrial integrity and metabolic activity of BAT.


Conflict of interest statement

The authors declare that they have no competing interests.

Figures

Figure 1
Figure 1
β3-adrenergic stimulation induces Cx43 expression in brown and white adipose tissue. (A) qPCR analysis of connexin expression levels in BAT (brown adipose tissue), iWAT (inguinal white adipose tissue), and gWAT (gonadal white adipose tissue) (mean ± S.E.M.; n = 3 per condition, ***P < 0.001). (B–E) Immunoblot analysis and quantification of Cx43 and UCP1 expression in BAT, iWAT and gWAT of mice treated with CL up to 5 days. Tubulin was used as a loading control. (mean ± S.E.M.; n = 4 per condition, *p < 0.05, **p < 0.01, ***p < 0.001) (Immunoblots accompanied by size markers in Fig. S6).
Figure 2
Figure 2
CL316,243 treatment increases mitochondrial localization of Cx43 in brown adipocytes. (A–C) Immunohistochemistry of Cx43 and MCAD in paraffin sections of BAT of mice treated with CL for 3 days and untreated controls. Nuclei were counterstained with DAPI. Bars = 5 or 20 μm as indicated. Magnified images of boxed regions of (B) are shown in panel (C). Arrows indicate close association between Cx43 and MCAD, whereas arrowhead indicates Cx43 expression detected mainly in plasma membrane. (D,E) Immunoblot analysis and quantification of Cx43 expression in mitochondrial, plasma membrane and cytosolic fractions of BAT from mice treated with CL for 3 days and untreated controls. (Mean ± S.E.M. n = 3 per condition, *p < 0.05) (F) Immunoblot analysis of Cx43 expression in mitochondrial fractions treated with 0.05% trypsin. (Immunoblots accompanied by size markers in Fig. S7).
Figure 3
Figure 3
Adipocyte-specific Gja1 KO reduces mitochondrial contents, but not PKA-downstream signaling in BAT. (A,B). Immunoblot analysis of Cx43 and UCP1 expression (A) and mitochondrial proteins involved in oxidative phosphorylation (B) in BAT of Gja1 adipoqKO mice and WT controls treated with CL up to 3 days. Two-way ANOVA revealed significant main effects of Gja1 expression in mitochondrial proteins (UCP1: p = 0.0001, ATP5A: p = 0.0004, UQCRC2: p = 0.015, NDUFB8: p = 0. 0004) and significant interaction of genotype and treatment (UCP1: p = 0.0166, NDUFB8: p = 0.0264). Significant differences between WT and KO were determined by post-hoc pairwise comparison with Bonferroni correction (mean ± SEM; n = 4 per condition, *p < 0.01, **p < 0.05, ***p < 0.001). (C) Immunoblot analysis of p-HSL and HSL expression in BAT of Gja1 adipoqKO mice and WT controls treated with CL up to 3 days (mean ± SEM; n = 4 per condition). (D) qPCR analysis of brown adipocyte markers and genes involved in downstream signaling of PKA activation in BAT of mice treated with CL for up to 5 days and untreated control mice. Two-way ANOVA revealed no significant main effects of Gja1 expression in mRNA levels (Ucp1: p = 0.4829, Ppargc1a: p = 0.178, Elovl3: p = 0.261, Dio2: p = 0.291, Nor1: p = 0.583, Plin2: p = 0.278, Lipe: p = 0.830) (mean ± SEM; n = 4 per condition). (Oil Vehicle controls in Fig. S2, Immunoblots accompanied by size markers in Fig. S8).
Figure 4
Figure 4
Adipose specific Gja1 KO generates abnormal mitochondria and increase autophagy in BAT. (A) Representative electron micrographs of BAT from WT and Gja1 adipoqKO mice treated with CL for 3 days and untreated controls. (B) Mitochondrion density in electron micrographs (mean ± SEM; n = 3 per condition). (C) Mitochondrion size in electron micrographs. Mean values were indicated above the scatter plots. (D) Distribution analysis of mitochondrion size. (E) Immunoblot analysis of LC3I/LC3BII ratio in BAT of Gja1 adipoqKO mice and WT controls treated with CL up to 3 days. Two-way ANOVA revealed significant main effects of Gja1 expression on LC3BII/LC3BI ratio (p = 0.0053).(mean ± SEM; n = 3 per condition). (F) qPCR analysis of autophagy markers in BAT of mice treated with CL for up to 3 days. Two-way ANOVA revealed significant main effects of Gja1 expression in mRNA levels (Atg9a: p = 0.0001, Atg7: p = 0.0041, Atg4b: p = 0.017, Naga: p = 0.0001). (mean ± SEM; n = 3 per condition, *p < 0.01, **p < 0.05, ***p < 0.001). (Immunoblots accompanied by size markers in Fig. S9).
Figure 5
Figure 5
In vitro knockdown of Cx43 increases autophagy and PKA-dependent ROS generation. (A–F). Effect of knockdown of Cx43 in adipocytes differentiated from C3H10T1/2 cells treated with siRNA targeting Gja1 and scramble controls. (A) Immunoblot analysis of Cx43 and mitochondrial proteins involved in oxidative phosphorylation (mean ± SEM; t-test, n = 4, *p < 0.05, **p < 0.01, ***p < 0.001). (B) qPCR analysis of Gja1 expression (mean ± SEM; t-test, n = 3, *p < 0.05). (C) Confocal microscopic images of LC3B and MitoTracker after 4hr of isoproterenol treatment (10μM). (D) qPCR analysis of expression of autophagy related genes. Two-way ANOVA revealed significant main effects of Gja1 expression in mRNA levels (Atg9a: p = 0.0001, Atg7: p = 0.0041, Atg4b: p = 0.017, Naga: p = 0.0001). Significant differences between controls and siRNA knockdown were determined by post-hoc pairwise comparison with Bonferroni correction (mean ± SEM; n = 4 per condition). (E) Flow cytometric analysis of autophagic flux in adipocytes differentiated from C3H10T1/2 cells overexpress eGFP-mCherry-LC3, transfected with siRNA targeting Gja or scramble control. The adipocytes were treated with isoproterenol or vehicle for 2hr before analysis. GFP/RFP ratio represents autophagic flux (mean ± SEM; t-test, n = 3, ***p < 0.001). (F) ROS generation during the course of isoproterenol treatment for up to 2 hr measured by H2-DCF fluorescence. (Immunoblots accompanied by size markers in Fig. S10).
Figure 6
Figure 6
Adipose specific Gja1 KO manifested reduction in CL-induced energy expenditure, cold intolerance and insulin resistance after a high fat diet challenge. (A,B) Indirect calorimetry analysis. Energy expenditure (EE) (A) and energy exchange ratio (RER) (B) are shown. Arrows indicate the time of CL injection. mean ± SEM, n = 6 per group). (C–E) Analysis of body temperature: core body temperature (C), thermal images (D), surface temperature of region of iBAT (E) in WT and Gja1 adipoqKO mice exposed at 22 °C and 4 °C for up to 4 hr (n = 4 per group). (F–H) Measurement of body weight (F), glucose tolerance test (GTT) (G), and insulin tolerance test (ITT) (H) in WT (tamoxifen-treated WT/Gja fl/fl), Oil-CTL (oil-treated aCre/Gja fl/fl) and Gja1 adipoqKO (tamoxifen-treated aCre/Gja fl/fl) mice fed with chow or high fat diet (HFD) for 8 weeks (n = 6 per group). Two-way ANOVA revealed significant main effects of genotype (GTT: p = 0.029, ITT: p = 0.047) and diet (GTT: p = 0.001, ITT: p = 0.0003) on area under the curve of GTT and ITT plots. Significant differences between WT and Gja1 adipoqKO were determined by post-hoc pairwise comparison with Bonferroni correction (mean ± SEM; *p < 0.05, NS = non-significant).

Similar articles

Cited by

References

    1. Cannon B, Nedergaard J. Brown adipose tissue: function and physiological significance. Physiol. Rev. 2004;84:277–359. doi: 10.1152/physrev.00015.2003. - DOI - PubMed
    1. Kajimura S, Spiegelman BM, Seale P. Brown and Beige Fat: Physiological Roles beyond Heat Generation. Cell Metab. 2015;22:546–559. doi: 10.1016/j.cmet.2015.09.007. - DOI - PMC - PubMed
    1. Burke S, et al. Adipocytes in both brown and white adipose tissue of adult mice are functionally connected via gap junctions: implications for Chagas disease. Microbes and Infection. 2014;16:893–901. doi: 10.1016/j.micinf.2014.08.006. - DOI - PMC - PubMed
    1. Chen J, et al. Activation of TRPV1 channel by dietary capsaicin improves visceral fat remodeling through connexin43-mediated Ca2+ Influx. Cardiovascular Diabetology. 2015;14:1–14. doi: 10.1186/s12933-014-0162-3. - DOI - PMC - PubMed
    1. Evans WH, Martin PE. Gap junctions: structure and function (Review) Molecular membrane biology. 2002;19:121–136. doi: 10.1080/09687680210139839. - DOI - PubMed

Publication types