

Innate Immune Basis for Rift Valley Fever Susceptibility in Mouse Models
- PMID: 28769107
- PMCID: PMC5541133
- DOI: 10.1038/s41598-017-07543-8
Innate Immune Basis for Rift Valley Fever Susceptibility in Mouse Models
Abstract
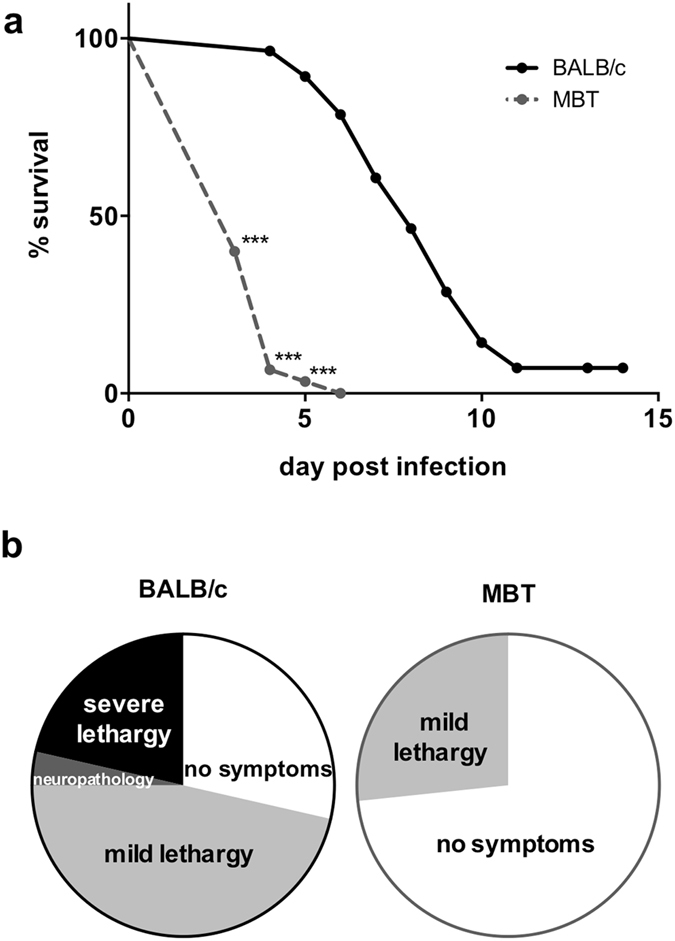
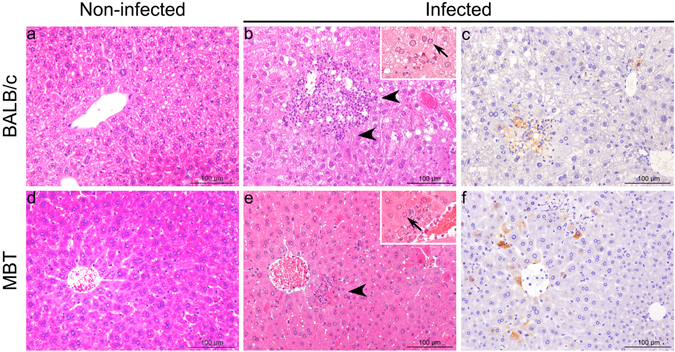
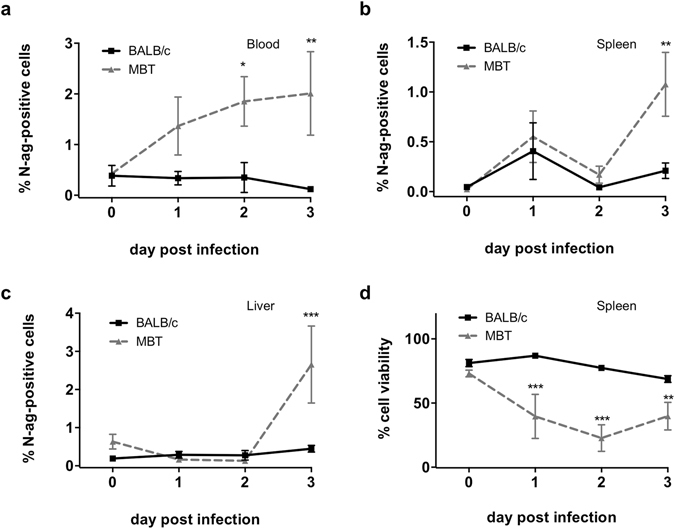
Rift Valley fever virus (RVFV) leads to varied clinical manifestations in animals and in humans that range from moderate fever to fatal illness, suggesting that host immune responses are important determinants of the disease severity. We investigated the immune basis for the extreme susceptibility of MBT/Pas mice that die with mild to acute hepatitis by day 3 post-infection compared to more resistant BALB/cByJ mice that survive up to a week longer. Lower levels of neutrophils observed in the bone marrow and blood of infected MBT/Pas mice are unlikely to be causative of increased RVFV susceptibility as constitutive neutropenia in specific mutant mice did not change survival outcome. However, whereas MBT/Pas mice mounted an earlier inflammatory response accompanied by higher amounts of interferon (IFN)-α in the serum compared to BALB/cByJ mice, they failed to prevent high viral antigen load. Several immunological alterations were uncovered in infected MBT/Pas mice compared to BALB/cByJ mice, including low levels of leukocytes that expressed type I IFN receptor subunit 1 (IFNAR1) in the blood, spleen and liver, delayed leukocyte activation and decreased percentage of IFN-γ-producing leukocytes in the blood. These observations are consistent with the complex mode of inheritance of RVFV susceptibility in genetic studies.
Conflict of interest statement
The authors declare that they have no competing interests.
Figures


Similar articles
-
A new mouse model reveals a critical role for host innate immunity in resistance to Rift Valley fever.J Immunol. 2010 Nov 15;185(10):6146-56. doi: 10.4049/jimmunol.1000949. Epub 2010 Oct 11. J Immunol. 2010. PMID: 20937849
-
Genetic dissection of Rift Valley fever pathogenesis: Rvfs2 locus on mouse chromosome 11 enables survival to early-onset hepatitis.Sci Rep. 2020 May 26;10(1):8734. doi: 10.1038/s41598-020-65683-w. Sci Rep. 2020. PMID: 32457349 Free PMC article.
-
Anti-nucleocapsid protein immune responses counteract pathogenic effects of Rift Valley fever virus infection in mice.PLoS One. 2011;6(9):e25027. doi: 10.1371/journal.pone.0025027. Epub 2011 Sep 16. PLoS One. 2011. PMID: 21949840 Free PMC article.
-
[Study on DNA immune of envelope protein gene of Rift Valley Fever Virus].Wei Sheng Wu Xue Bao. 2007 Aug;47(4):677-81. Wei Sheng Wu Xue Bao. 2007. PMID: 17944371 Chinese.
-
Single-cycle replicable Rift Valley fever virus mutants as safe vaccine candidates.Virus Res. 2016 May 2;216:55-65. doi: 10.1016/j.virusres.2015.05.012. Epub 2015 May 27. Virus Res. 2016. PMID: 26022573 Free PMC article. Review.
Cited by
-
Rift Valley Fever Virus Non-Structural Protein S Is Associated with Nuclear Translocation of Active Caspase-3 and Inclusion Body Formation.Viruses. 2022 Nov 10;14(11):2487. doi: 10.3390/v14112487. Viruses. 2022. PMID: 36366585 Free PMC article.
-
Genetic diversity of collaborative cross mice enables identification of novel rift valley fever virus encephalitis model.PLoS Pathog. 2022 Jul 14;18(7):e1010649. doi: 10.1371/journal.ppat.1010649. eCollection 2022 Jul. PLoS Pathog. 2022. PMID: 35834486 Free PMC article.
-
Multifunctional human monoclonal antibody combination mediates protection against Rift Valley fever virus at low doses.Nat Commun. 2023 Sep 13;14(1):5650. doi: 10.1038/s41467-023-41171-3. Nat Commun. 2023. PMID: 37704627 Free PMC article.
-
Rift Valley Fever Virus-Infection, Pathogenesis and Host Immune Responses.Pathogens. 2023 Sep 19;12(9):1174. doi: 10.3390/pathogens12091174. Pathogens. 2023. PMID: 37764982 Free PMC article. Review.
-
Neutrophil and macrophage influx into the central nervous system are inflammatory components of lethal Rift Valley fever encephalitis in rats.PLoS Pathog. 2019 Jun 20;15(6):e1007833. doi: 10.1371/journal.ppat.1007833. eCollection 2019 Jun. PLoS Pathog. 2019. PMID: 31220182 Free PMC article.
References
Publication types
MeSH terms
Substances
LinkOut - more resources
Full Text Sources
Other Literature Sources
Molecular Biology Databases
