

doi: 10.1038/290107a0.
Structure of the hydrophobic protein crambin determined directly from the anomalous scattering of sulphur
Affiliations
- PMID: 28769131
- PMCID: PMC5536114
- DOI: 10.1038/290107a0
Item in Clipboard
Structure of the hydrophobic protein crambin determined directly from the anomalous scattering of sulphur
Nature.
.
Abstract
The highly ordered crystal structure of crambin has been solved at 1.5 Å resolution directly from the diffraction data of a native crystal at a wavelength remote from the sulphur absorption edge. The molecule has three disulphide bridges among its 46 amino acid residues, of which 46% are in helices and 17% are in a β-sheet. Crambin is shown to be an amphipathic protein, inasmuch as its six charged groups are segregated from hydrophobic surface elements. Phasing methods used here will also apply elsewhere.
Figures
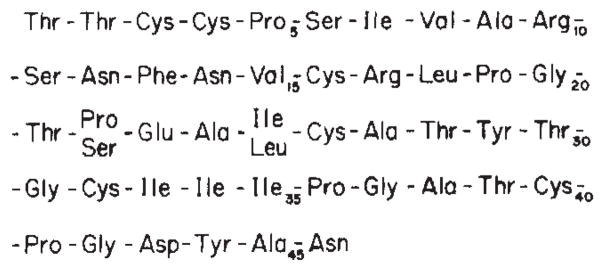
The amino acid sequence of crambin. Details of the sequence analysis are given in ref. .
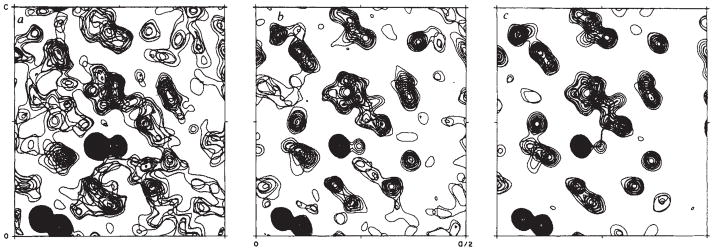
A portion of the electron-density distribution for crambin at three stages in the analysis. Each frame encloses an area bounded by 0 < x < a/2 and 0 < z < c and is a composite of the sections at y = (19–21)b/40. The adjacent, dense spherical features at the lower left are the sulphur atoms of Cys 16–Cys 26. The dense spheroid near the centre of each frame is Sγ of Cys 32. Sγ of Cys 4 lies just to the right of this and is centred above these sections. The ring of Pro 5 is seen in the plane of these sections. All the maps are at 1.5 Å resolution. Frame a is part of the initial Fourier synthesis from which the structure was interpreted. Coefficients of
were used with figures of merit and phases determined as follows. Bimodal anomalous distributions for which the partial-structure choice-probability exceeded 0.7 were given the phase of the chosen mode and weighted by the intrinsic figure of merit (30% of the 5,660 reflections). Phasing for relatively sharp unimodal distributions, mano>0.4 and mano>mcombine, was kept at ϕano and mano (8%). For the remaining cases, the centroid phases and weights, mcombine, were determined from multiplicatively combined distributions. These included the centric zonals (11%) and error rejects (2%), for which there was no anomalous phasing, as well as the other general reflections (48%). Partial structure probabilities were computed with Q = 2. Overall, m̄ = 0.55. Frame b is from the first (2Fobs–Fcalc), ϕcalc map after direct refinement of the initial model to an agreement factor of R = 0.322. Frame c is the latest (2Fobs – Fcalc), ϕcalc map from the model at R = 0.104.
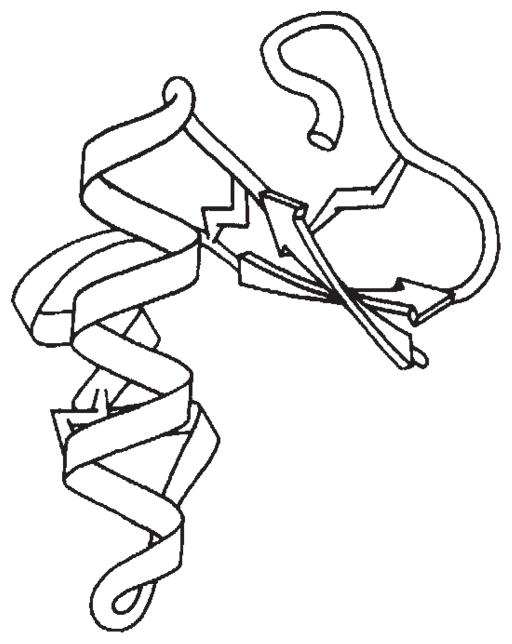
A schematic drawing of the backbone of crambin. This representation of crambin was drawn by Jane Richardson to be faithful to computer drawings of the skeleton. Arrows depict β-strands. The disulphides are drawn as ‘lightning flashes’. The reader looks down along b; a* runs from left to right and c runs from page bottom to page top.
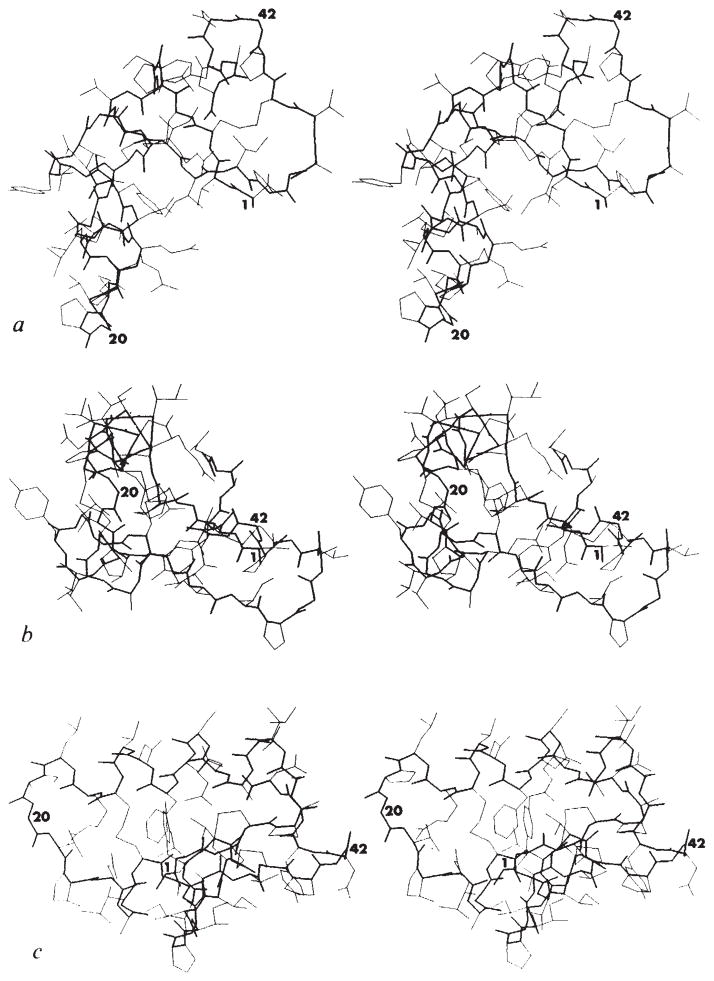
Stereo drawings of the crambin atomic structures. Bonds along the main-chain backbone are enhanced. The conformational and compositional heterogeneity at positions 7, 22 and 25 is included. Residue numbers are given near the Cα positions of Thr 1, Gly 20 and Gly 42 in each of the views. a, View, as in Fig. 3, through the thinnest dimension. b, View along c with a* running from left to right. This is approximately along the helical stem and perpendicular to the β-sheet (towards the back at the right). c, View into a* with c running from left to right. This is approximately perpendicular to the helix axes as seen from the β-arm side. These stick figures and the surface diagrams (Figs 5 and 6) were all drawn using the program PLT1 written by G. J. Quigley.
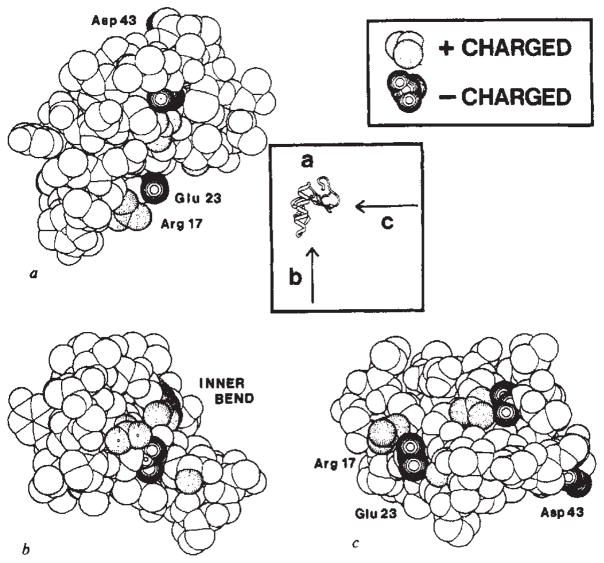
Ionic surface of crambin. These surface representations of crambin have the following Van der Waals radii: C, 1.7 Å; N, 1.4 Å; O, 1.4 Å and S, 2.1 Å. No hydrogen atoms are included. Positively charged groups of atoms are shaded with dotted circles and negatively charged groups are shaded with solid circles. a, View of the molecule as in Fig. 3 and in Fig. 4a. b, View looking into the inner bend of the Γ from along the helix axes as in Fig. 4b. c, View looking into the inner bend perpendicular to the helix axes as in Fig. 4c.
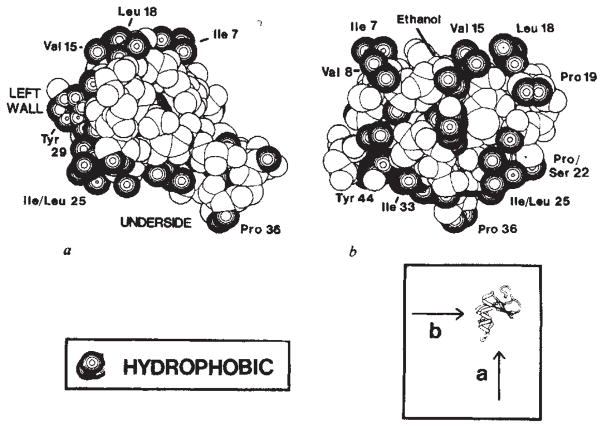
Hydrophobic surface of crambin. The radii used here are the same as those in Fig. 5. Atoms designated as hydrophobic here only include the side-chain carbon atoms of Ala, Val, Leu, Ile, Phe and Tyr residues, Cβ and Cγ of Pro and Cγ2 of Thr. a, View looking into the hydrophilic inner bend, as in Figs 4b and 5b, showing hydrophobic residues that line the left-wall and underside surfaces. b, View looking into the left-wall surface along a* with c running from right to left. Note that the polar side chain of Asn 12 is partially covered by the hydrophobic cloak of an ethanol molecule.
References
-
- Bijvoet JM. Proc Acad Sci Arnst. 1949;B52:313–314.
-
- Ramaseshan S, Abrahams SC, editors. Anomalous Scattering. Munksgaard; Copenhagen: 1975.
-
- Peerdeman AF, Bijvoet JM. Acta crystallogr. 1956;9:1012–1015.
-
- Ramachandran GN, Raman S. Curr Sci. 1956;25:348–351.
-
- Okaya Y, Pepinsky R. Phys Rev. 1956;103:1645–1647.
Grants and funding
LinkOut - more resources
Full Text Sources
