. 2017 Jul 14:8:1294.
doi: 10.3389/fmicb.2017.01294. eCollection 2017.

Unraveling Core Functional Microbiota in Traditional Solid-State Fermentation by High-Throughput Amplicons and Metatranscriptomics Sequencing

Affiliations

Unraveling Core Functional Microbiota in Traditional Solid-State Fermentation by High-Throughput Amplicons and Metatranscriptomics Sequencing

Zhewei Song et al. Front Microbiol. .

Abstract

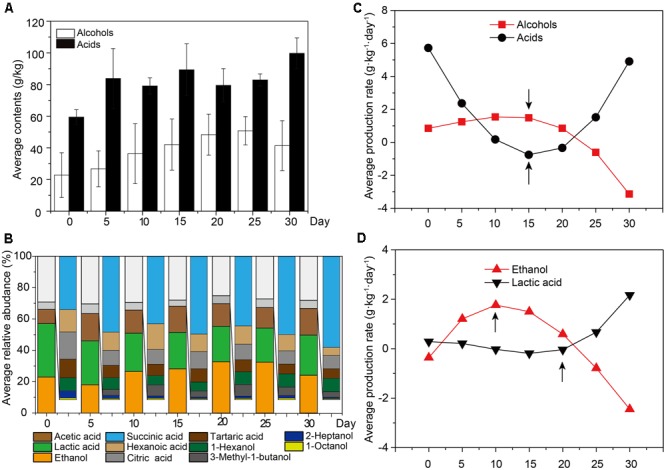
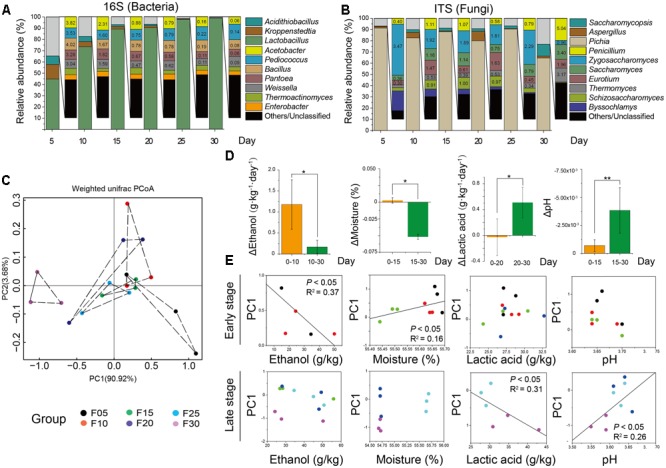
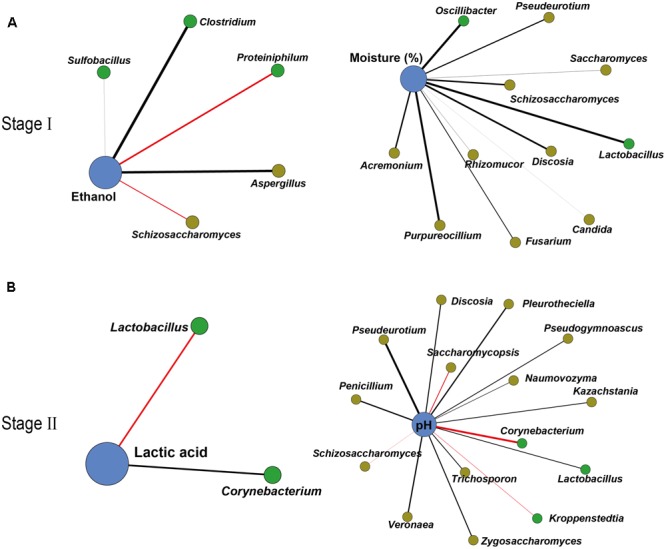
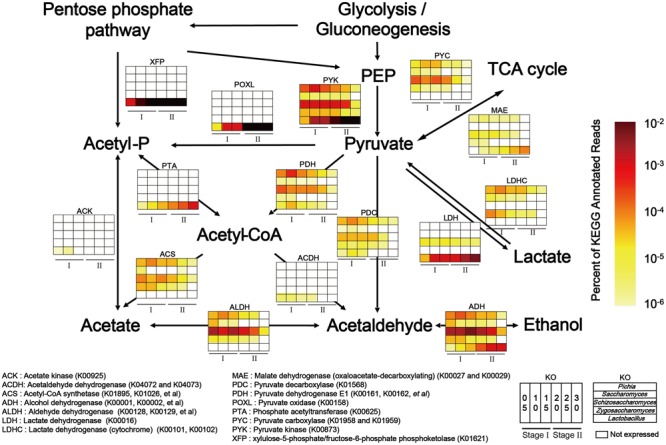
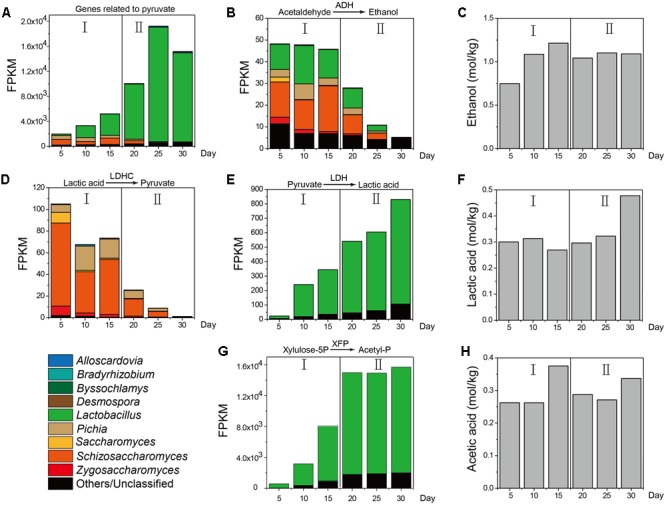
Fermentation microbiota is specific microorganisms that generate different types of metabolites in many productions. In traditional solid-state fermentation, the structural composition and functional capacity of the core microbiota determine the quality and quantity of products. As a typical example of food fermentation, Chinese Maotai-flavor liquor production involves a complex of various microorganisms and a wide variety of metabolites. However, the microbial succession and functional shift of the core microbiota in this traditional food fermentation remain unclear. Here, high-throughput amplicons (16S rRNA gene amplicon sequencing and internal transcribed space amplicon sequencing) and metatranscriptomics sequencing technologies were combined to reveal the structure and function of the core microbiota in Chinese soy sauce aroma type liquor production. In addition, ultra-performance liquid chromatography and headspace-solid phase microextraction-gas chromatography-mass spectrometry were employed to provide qualitative and quantitative analysis of the major flavor metabolites. A total of 10 fungal and 11 bacterial genera were identified as the core microbiota. In addition, metatranscriptomic analysis revealed pyruvate metabolism in yeasts (genera Pichia, Schizosaccharomyces, Saccharomyces, and Zygosaccharomyces) and lactic acid bacteria (genus Lactobacillus) classified into two stages in the production of flavor components. Stage I involved high-level alcohol (ethanol) production, with the genus Schizosaccharomyces serving as the core functional microorganism. Stage II involved high-level acid (lactic acid and acetic acid) production, with the genus Lactobacillus serving as the core functional microorganism. The functional shift from the genus Schizosaccharomyces to the genus Lactobacillus drives flavor component conversion from alcohol (ethanol) to acid (lactic acid and acetic acid) in Chinese Maotai-flavor liquor production. Our findings provide insight into the effects of the core functional microbiota in soy sauce aroma type liquor production and the characteristics of the fermentation microbiota under different environmental conditions.

Keywords: amplicons; core functional microbiota; fermentation microbiota; functional shift; high-throughput sequencing; metatranscriptomics; microbial succession; solid-state fermentation.


Figures

FIGURE 1
FIGURE 1
The average content of flavor components across all the samples. Samples were sorted based on the fermentation time. (A) Average content of alcohols and acids across all the samples (n = 18, each bar n = 3). (B) Average relative abundance of major alcohols and acids across all the samples (n = 18, each bar n = 3). (C) The production rate of major alcohols and acidsacross all the samples (n = 18). (D) The production rate of ethanol and lactic acidacross all the samples (n = 18).
FIGURE 2
FIGURE 2
Microbiota and major flavor components analysis across all the samples. Average bacterial (A) and fungal (B) distribution at the genus-level in microbiota based on 16S rRNA gene and ITS amplicons (n = 18, each bar n = 3). (C) Amplicons analysis represented the similarities of microbial compositions based on principal component analysis (PCA). (D) Ethanol, lactic acid, and acetic acid production had different stages. Bars represented mean (±SE). Asterisk indicates significant differences by Mann–Whitney U test (P < 0.05). (E) Plots of PC1 versus four factors showed that ethanol and lactic acid had significant correlation with microbiota in different stages by Spearman correlation coefficient (P < 0.05).
FIGURE 3
FIGURE 3
Correlation network between microbiota and endogenous factors. Spearman correlation coefficient depicted significant negative and positive correlations (P < 0.05) between microbiota and endogenous factors in Stage I (A) and Stage II (B) (relative abundance > 0.01%). Edge thickness represented the value. Edge color represented the positive (red) or negative (black) correlation. Edge length and point sizes had no meaning for the present study.
FIGURE 4
FIGURE 4
Relative abundance of KEGG expression genes in pyruvate metabolism related to genera Pichia, Schizosaccharomyces, Saccharomyces, Zygosaccharomyces, and Lactobacillus in different stages (Stage I: samples from days 5 to 15 and Stage II: samples from days 20 to 30 (n = 6). Color depth represented the proportion of total reads mapping to KEGG metabolic pathway in all KEGG annotated reads.
FIGURE 5
FIGURE 5
KEGG expression genes in pyruvate metabolism associated with the measured content of ethanol, lactic acid, and acetic acid in different stages (n = 6). (A) FPKM (Fragments per Kilobase of transcript per Million mapped reads) of KEGG expression genes related to pyruvate. (B) FPKM of KEGG expression genes related to metabolic pathway from acetaldehyde to ethanol. (C) Ethanol content from Stage I to Stage II. (D) FPKM of KEGG expression genes related to metabolic pathway from lactic acid to pyruvate. (E) FPKM of KEGG expression genes from pyruvate to lactic acid. (F) Lactic acid content from Stage I to Stage II. (G) FPKM of KEGG expression genes from pyruvate to acetyl-phosphate. (H) Acetic acid content from Stage I to Stage II.

References

    1. Aldrete-Tapia A., Escobar-Ramírez M. C., Tamplin M. L., Hernández-Iturriaga M. (2014). High-throughput sequencing of microbial communities in Poro cheese, an artisanal Mexican cheese. Food Microbiol. 44 136–141. 10.1016/j.fm.2014.05.022 - DOI - PubMed
    1. Angly F. E., Heath C., Morgan T. C., Tonin H., Rich V., Schaffelke B., et al. (2016). Marine microbial communities of the Great Barrier Reef lagoon are influenced by riverine floodwaters and seasonal weather events. Peer J. 4:e1511 10.7717/peerj.1511 - DOI - PMC - PubMed
    1. Araque I., Bordons A., Reguant C. (2013). Effect of ethanol and low pH on citrulline and ornithine excretion and arc gene expression by strains of Lactobacillus brevis and Pediococcus pentosaceus. Food Microbiol. 33 107–113. 10.1016/j.fm.2012.09.005 - DOI - PubMed
    1. Astudillo-Garcia C., Bell J. J., Webster N. S., Glasl B., Jompa J., Montoya J. M., et al. (2017). Evaluating the core microbiota in complex communities: a systematic investigation. Environ. Microbiol. 19 1450–1462. 10.1111/1462-2920.13647 - DOI - PubMed
    1. Azwar M. Y., Hussain M. A., Abdul-Wahab A. K. (2014). Development of biohydrogen production by photobiological, fermentation and electrochemical processes: a review. Renew. Sustain. Energy Rev. 31 158–173. 10.1016/j.rser.2013.11.022 - DOI