. 2017 Jul 18:8:1362.
doi: 10.3389/fmicb.2017.01362. eCollection 2017.

Bacterial Community Associated with Healthy and Diseased Pacific White Shrimp (Litopenaeus vannamei) Larvae and Rearing Water across Different Growth Stages

Affiliations

Bacterial Community Associated with Healthy and Diseased Pacific White Shrimp (Litopenaeus vannamei) Larvae and Rearing Water across Different Growth Stages

Yanfen Zheng et al. Front Microbiol. .

Abstract

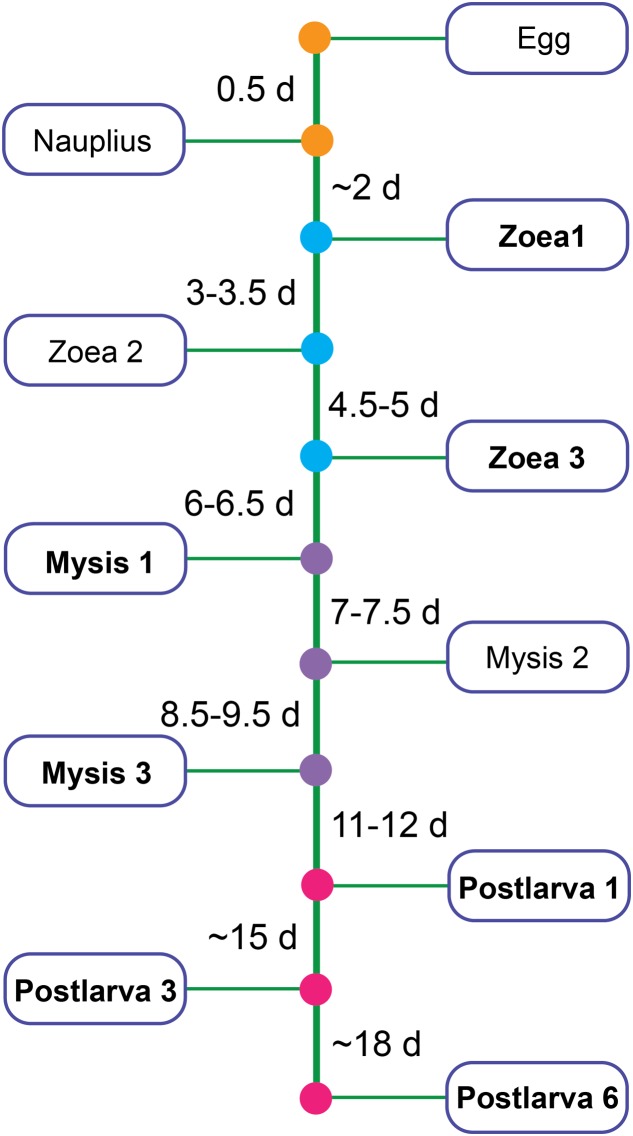
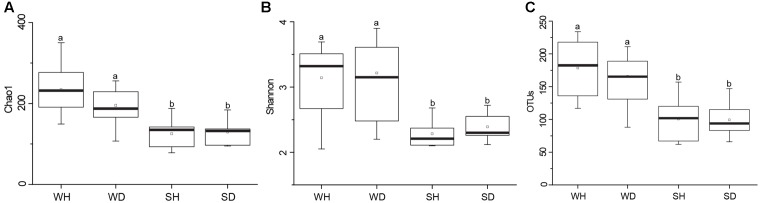
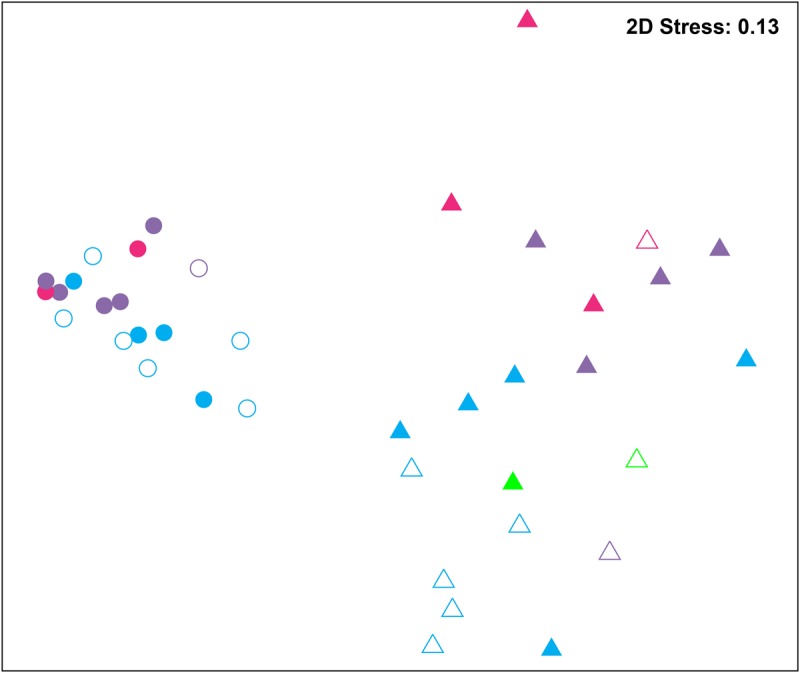
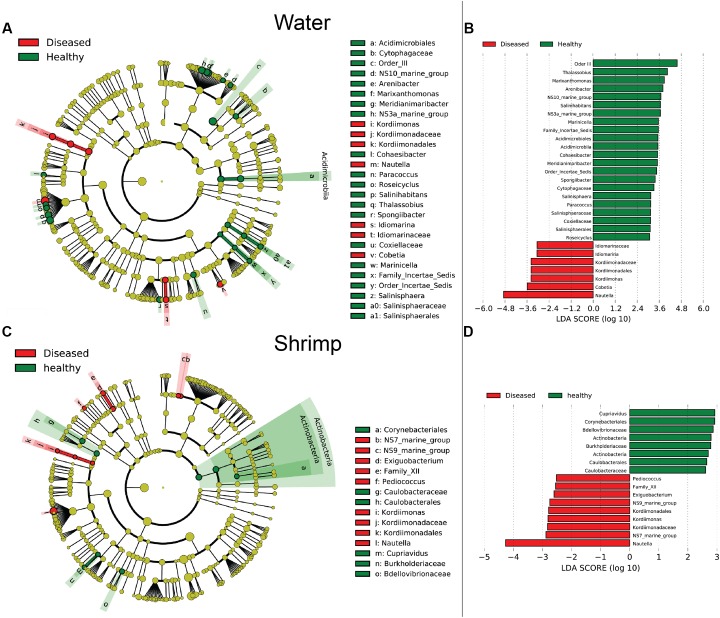
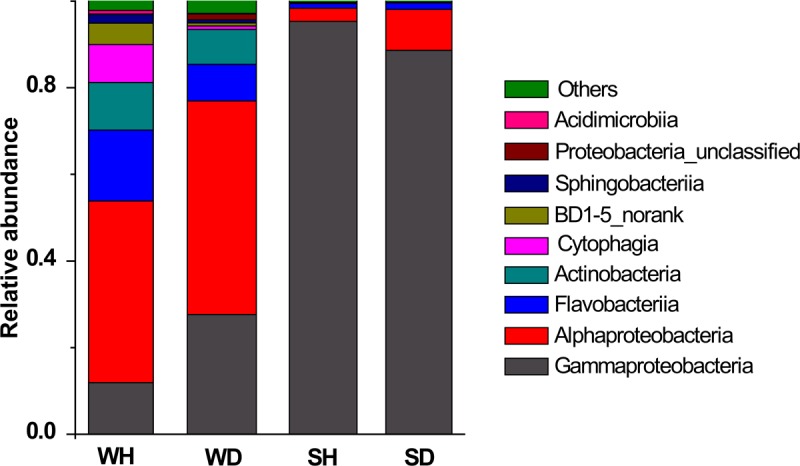
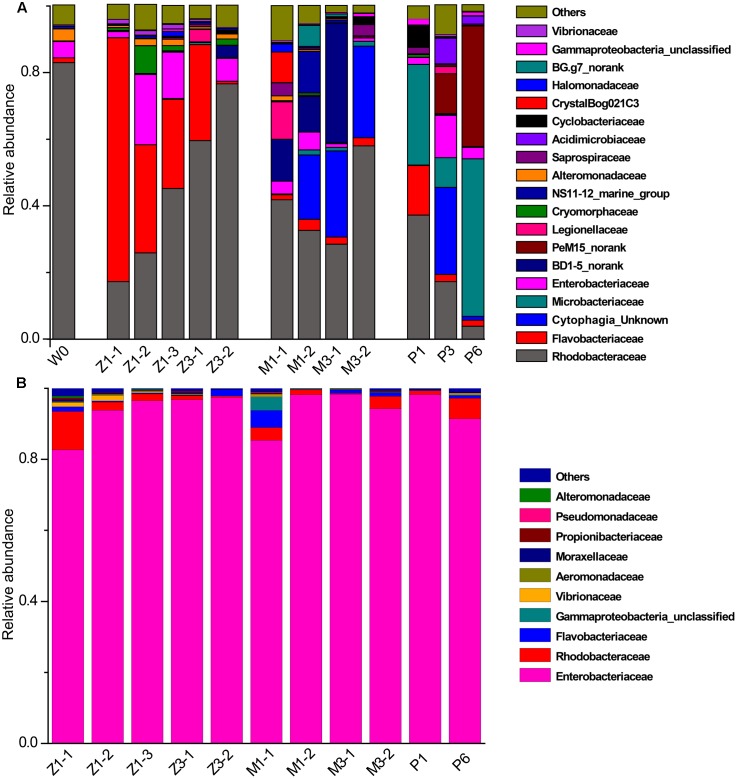
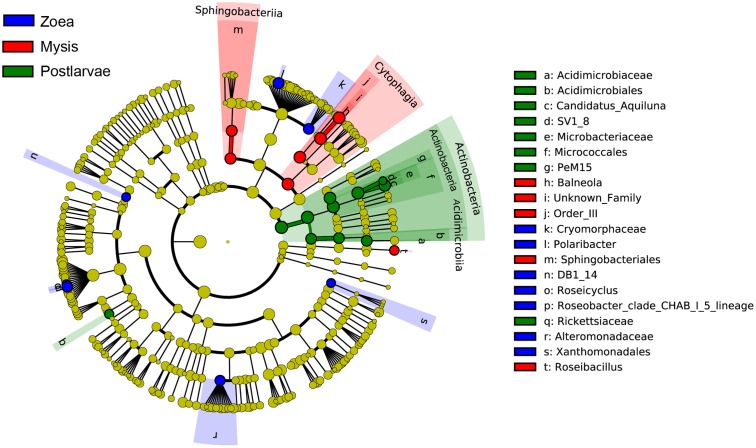
Bacterial communities are called another "organ" for aquatic animals and their important influence on the health of host has drawn increasing attention. Thus, it is important to study the relationships between aquatic animals and bacterial communities. Here, bacterial communities associated with Litopenaeus vannamei larvae at different healthy statuses (diseased and healthy) and growth stages (i.e., zoea, mysis, and early postlarvae periods) were examined using 454-pyrosequencing of the 16S rRNA gene. Bacterial communities with significant difference were observed between healthy and diseased rearing water, and several bacterial groups, such as genera Nautella and Kordiimonas could also distinguish healthy and diseased shrimp. Rhodobacteraceae was widely distributed in rearing water at all growth stages but there were several stage-specific groups, indicating that bacterial members in rearing water assembled into distinct communities throughout the larval development. However, Gammaproteobacteria, mainly family Enterobacteriaceae, was the most abundant group (accounting for more than 85%) in shrimp larvae at all growth stages. This study compared bacterial communities associated with healthy and diseased L. vannamei larvae and rearing water, and identified several health- and growth stage-specific bacterial groups, which might be provided as indicators for monitoring the healthy status of shrimp larvae in hatchery.

Keywords: 454 pyrosequencing; Litopenaeus vannamei larvae; bacterial community; disease; growth stages; health.


Figures

FIGURE 1
FIGURE 1
Partial developmental time line of shrimp. Bold type represents the stage chosen to be analyzed in this study.
FIGURE 2
FIGURE 2
Boxplots of bacterial diversity and richness in WH, WD, SH, and SD. The top and bottom boundaries of each box show the 75th and 25th quartile values, respectively. The black lines within each box represent 50th quartile values. Ends of the whiskers indicate the lowest and highest values. The different letter above the boxes indicate that there is significant difference between groups (P < 0.05). (A,B) Chao 1 and Shannon indices used to estimate bacterial diversity for each group; (C), OTUs used to determine species richness. WH: water samples from ponds with healthy shrimps, WD: water samples from ponds with diseased shrimps, SH: shrimp samples from ponds with healthy shrimps, SD: shrimp samples from ponds with diseased shrimps.
FIGURE 3
FIGURE 3
Non-metric multidimensional scaling (NMDS) analysis of all samples based on OTU level. Bray–Curtis similarity metric was used with PRIMER 6. Circle and triangle represent shrimp and water samples, respectively. Blue, purple, and red represent zoea, mysis, and postlarvae stages, respectively. Green: rearing water before larvae were released into pond. Symbols filled and unfilled color indicated healthy and diseased, respectively.
FIGURE 4
FIGURE 4
The cladograms of bacterial lineages with significant difference between WH and WD, and between SH and SD. The bacterial groups from phylum to genus level are listed from center to outside. Each circle’s diameter is proportional to the bacterial taxon’s abundance. Green: bacterial taxa enriched in healthy water or shrimp; red: bacterial taxa enriched in diseased water or shrimp; yellow: no significant differences. (A,C) Only the taxa that linear discriminate analysis (LDA) value above 3.0 for rearing water and 2.5 for shrimp larvae are shown, respectively. (B,D) The length of column represented the effect size of bacterial lineages.
FIGURE 5
FIGURE 5
Bacterial composition associated with WH, WD, SH, and SD (based on class level). WH: water samples from ponds with healthy shrimps, WD: water samples from ponds with diseased shrimps, SH: shrimp samples from ponds with healthy shrimps, SD: shrimp samples from ponds with diseased shrimps.
FIGURE 6
FIGURE 6
Principal component analysis (PCA) plot of rearing water under different growth stages at family level. W0: water before larvae were released into pond. Z, zoea; M, mysis; P, postlarvae.
FIGURE 7
FIGURE 7
Relative abundance of the dominant bacterial families in rearing water and shrimp. (A) Rearing water; (B) shrimp. W0: water before larvae were released into pond; Z, zoea; M, mysis; P, postlarvae.
FIGURE 8
FIGURE 8
The cladograms of bacterial lineages with significant difference in rearing water under different growth stages. The bacterial groups from phylum to genus level are listed from center to outside. Each circle’s diameter is proportional to the bacterial taxon’s abundance. Blue: bacterial taxa enriched in zoea stage; red: bacterial taxa enriched in mysis stage; Green: bacterial taxa enriched in postlarva stage; yellow: no significant differences. Only the taxa that LDA value above 3.0 are shown.

Similar articles

Cited by

References

    1. Caporaso J. G., Kuczynski J., Stombaugh J., Bittinger K., Bushman F. D., Costello E. K., et al. (2010). QIIME allows analysis of high-throughput community sequencing data. Nat. Methods 7 335–336. 10.1038/nmeth.f.303 - DOI - PMC - PubMed
    1. Chaiyapechara S., Rungrassamee W., Suriyachay I., Kuncharin Y., Klanchui A., Karoonuthaisiri N., et al. (2012). Bacterial community associated with the intestinal tract of P. monodon in commercial farms. Microb. Ecol. 63 938–953. 10.1007/s00248-011-9936-2 - DOI - PubMed
    1. Chao A., Bunge J. (2002). Estimating the number of species in a stochastic abundance model. Biometrics 58 531–539. 10.1111/j.0006-341X.2002.00531.x - DOI - PubMed
    1. Clarke K. R., Gorley R. N. (2006). PRIMER v6: User Manual/Tutorial. Plymouth: PRIMER-E, 190.
    1. Edgar R. C. (2013). UPARSE: highly accurate OTU sequences from microbial amplicon reads. Nat. Methods 10 996–998. 10.1038/nmeth.2604 - DOI - PubMed

LinkOut - more resources