

Evolutionary implications of Liebig's law of the minimum: Selection under low concentrations of two nonsubstitutable nutrients
- PMID: 28770068
- PMCID: PMC5528229
- DOI: 10.1002/ece3.3096
Evolutionary implications of Liebig's law of the minimum: Selection under low concentrations of two nonsubstitutable nutrients
Abstract
Interactions between different axes of an organism's niche determine the evolutionary trajectory of a population. An extreme case of these interactions is predicted from ecological theory in Liebig's law of the minimum. This law states that in environments where multiple nutrients are in relatively low concentrations, only one nutrient will affect the growth of the organism. This implies that the evolutionary response of the population would be dictated by the most growth-limiting nutrient. Alternatively, it is possible that an initial adaptation to the most limiting nutrient results in other nutrients present in low concentration affecting the evolutionary dynamics of the population. To test these hypotheses, we conducted twelve evolution experiments in chemostats using Escherichia coli populations: four under nitrogen limitation, four under magnesium limitation, and four in which both nitrogen and magnesium are in low concentrations. In the last environment, only magnesium seems to limit growth (Low Nitrogen Magnesium Limited environment, LNML). We observe a decrease in nitrogen concentration in the LNML environment over the course of our evolution experiment indicating that nitrogen might become limiting in these environments. Genetic reconstruction results show that clones adapted to magnesium limitation have genes involved in nitrogen starvation, that is, glnG (nitrogen starvation transcriptional regulator) and amtB (transport protein) to be upregulated only in the LNML environment as compared to magnesium-limiting environments. Together, our results highlights that in low-nutrient environments, adaptation to the growth-limiting nutrient results in other nutrients at low concentrations to play a role in the evolutionary dynamics of the population.
Keywords: Escherichia coli; Liebig; experimental evolution; magnesium limitation; nitrogen limitation.
Figures

 for 0 mmol/L, ‐ ‐ for 0.4 mmol/L and – – for 0.8 mmol/L). Nitrogen‐limiting concentrations represent conditions where ammonium was not detected using an indophenol assay (■). Δ represents environments where nitrogen was detected. Experimental evolution was performed at concentrations denoted by A (0.7 mmol/L nitrogen, 0.8 mmol/L magnesium), B (14 mmol/L nitrogen, 0 mmol/L magnesium), and C (0.7 mmol/L nitrogen, 0 mmol/L magnesium), which represents nitrogen‐limitation, magnesium‐limitation, and


 ), in a magnesium‐limited environment (
 ) and in a nitrogen‐limited environment (
 ). The samples were taken at 72, 168, 240, and 400 generations
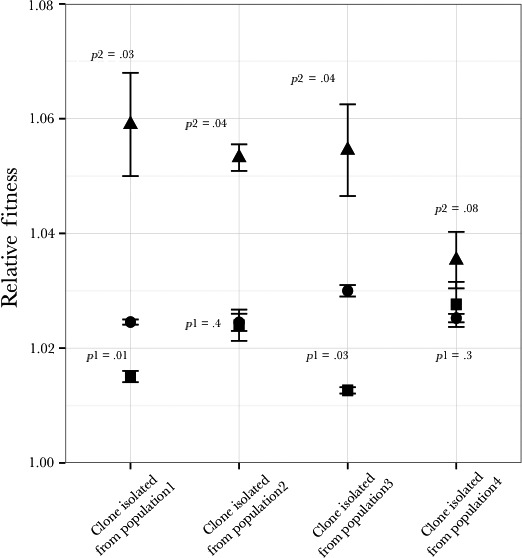
 ), Population 2 (
 ), Population 3 (
 ), and Population 4 (
 )
)
Similar articles
-
Different adaptive strategies in E. coli populations evolving under macronutrient limitation and metal ion limitation.BMC Evol Biol. 2018 May 18;18(1):72. doi: 10.1186/s12862-018-1191-4. BMC Evol Biol. 2018. PMID: 29776341 Free PMC article.
-
Nutrient limitation on terrestrial plant growth--modeling the interaction between nitrogen and phosphorus.New Phytol. 2012 Jun;194(4):953-960. doi: 10.1111/j.1469-8137.2012.04116.x. Epub 2012 Mar 28. New Phytol. 2012. PMID: 22458659
-
Multiple nutrient limitation in unicellulars: reconstructing Liebig's law.Math Biosci. 1998 Apr;149(1):1-22. doi: 10.1016/s0025-5564(97)10019-0. Math Biosci. 1998. PMID: 9610108
-
The concept of multiple-nutrient-limited growth of microorganisms and its application in biotechnological processes.Biotechnol Adv. 2003 Dec;22(1-2):35-43. doi: 10.1016/j.biotechadv.2003.08.006. Biotechnol Adv. 2003. PMID: 14623042 Review.
-
On multiple-nutrient-limited growth of microorganisms, with special reference to dual limitation by carbon and nitrogen substrates.Antonie Van Leeuwenhoek. 1991 Oct-Nov;60(3-4):225-34. doi: 10.1007/BF00430367. Antonie Van Leeuwenhoek. 1991. PMID: 1687236 Review.
Cited by
-
Modelling of Lemna minor L. growth as influenced by nutrient supply, supplemental light, CO2 and harvest intervals for a continuous indoor cultivation.Heliyon. 2022 Dec 8;8(12):e12194. doi: 10.1016/j.heliyon.2022.e12194. eCollection 2022 Dec. Heliyon. 2022. PMID: 36578429 Free PMC article.
-
Adaptation to a limiting element involves mitigation of multiple elemental imbalances.J R Soc Interface. 2023 Jan;20(198):20220472. doi: 10.1098/rsif.2022.0472. Epub 2023 Jan 4. J R Soc Interface. 2023. PMID: 36596454 Free PMC article.
-
Different adaptive strategies in E. coli populations evolving under macronutrient limitation and metal ion limitation.BMC Evol Biol. 2018 May 18;18(1):72. doi: 10.1186/s12862-018-1191-4. BMC Evol Biol. 2018. PMID: 29776341 Free PMC article.
-
A Chemostat-Based Model for Growing Bacterial Biofilms.bioRxiv [Preprint]. 2025 Jun 23:2025.06.22.660958. doi: 10.1101/2025.06.22.660958. bioRxiv. 2025. PMID: 40667298 Free PMC article. Preprint.
-
Human Nutrition Research in the Data Era: Results of 11 Reports on the Effects of a Multiple-Micronutrient-Intervention Study.Nutrients. 2024 Jan 5;16(2):188. doi: 10.3390/nu16020188. Nutrients. 2024. PMID: 38257081 Free PMC article. Review.
References
-
- de Baar, H. J. W. (1994). von Liebig's Law of the Minimum and plankton ecology (1899–1991). Progress in Oceanography, 33, 347–386.
-
- Bennett, A. F. , Lenski, R. E. , & Mittler, J. E. (1992). Evolutionary adaptation to temperature. I. Fitness responses of Escherichia coli to changes in its thermal environment. Evolution, 46, 16–30. - PubMed
-
- Bolnick, D. I. (2001). Intraspecific competition favours niche width expansion in Drosophila melanogaster . Nature, 410, 463–466. - PubMed
-
- Catalano, G. (1987). An improved method for the determination of ammonia in seawater. Marine Chemistry, 20, 289–295.
LinkOut - more resources
Full Text Sources
Other Literature Sources
