

Massive Accumulation of Myofibroblasts in the Critical Isthmus Is Associated With Ventricular Tachycardia Inducibility in Post-Infarct Swine Heart
- PMID: 28770255
- PMCID: PMC5527067
- DOI: 10.1016/j.jacep.2016.11.010
Massive Accumulation of Myofibroblasts in the Critical Isthmus Is Associated With Ventricular Tachycardia Inducibility in Post-Infarct Swine Heart
Abstract
Objectives: In this study the authors determined the extent of cellular infiltration and dispersion, and regional vascularization in electrophysiologically (EP) defined zones in post-myocardial infarction (MI) swine ventricle.
Background: The critical isthmus (CI) in post-MI re-entrant ventricular tachycardia (VT) is a target for catheter ablation. In vitro evidence suggests that myofibroblasts (MFB) within the scar border zone (BZ) may increase the susceptibility to slow conduction and VT, but whether this occurs in vivo remains unproven.
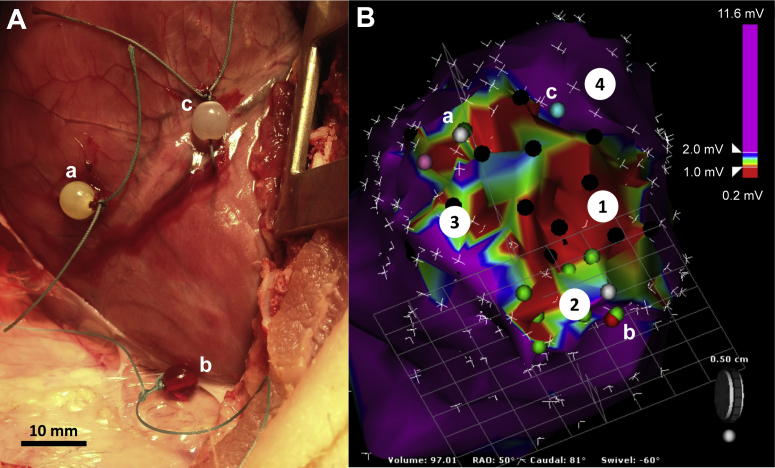
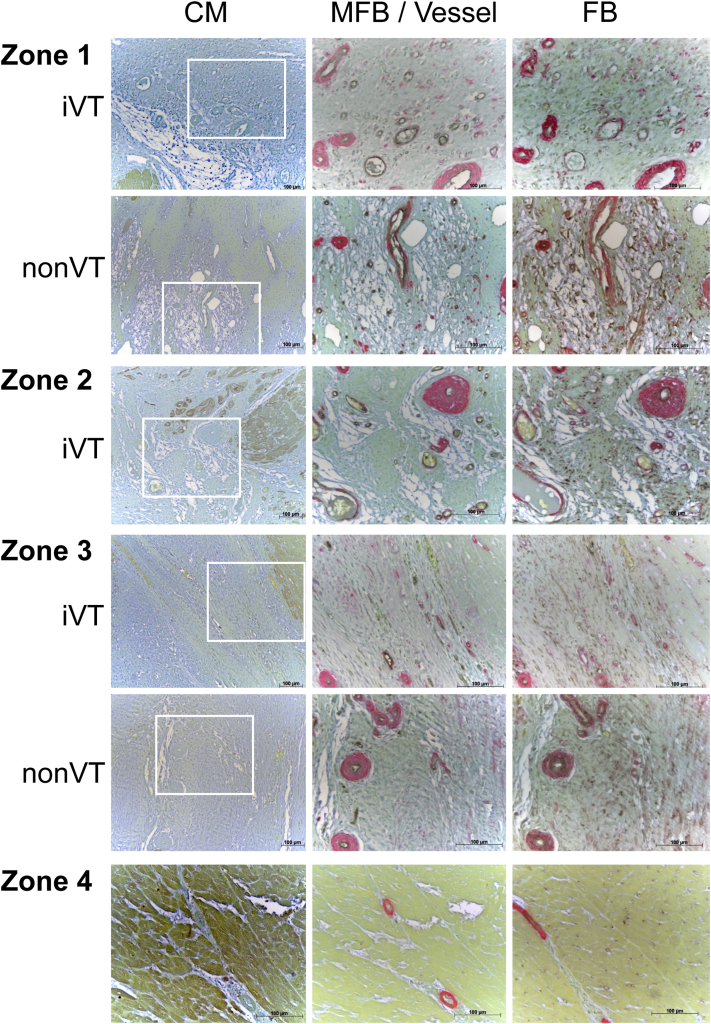
Methods: Six weeks after mid-left anterior descending coronary artery occlusion, EP catheter-based mapping was used to assess susceptibility to VT induction. EP data were correlated with detailed cellular profiling of ventricular zones using immunohistochemistry and spatial distribution analysis of cardiomyocytes, fibroblasts, MFB, and vascularization.
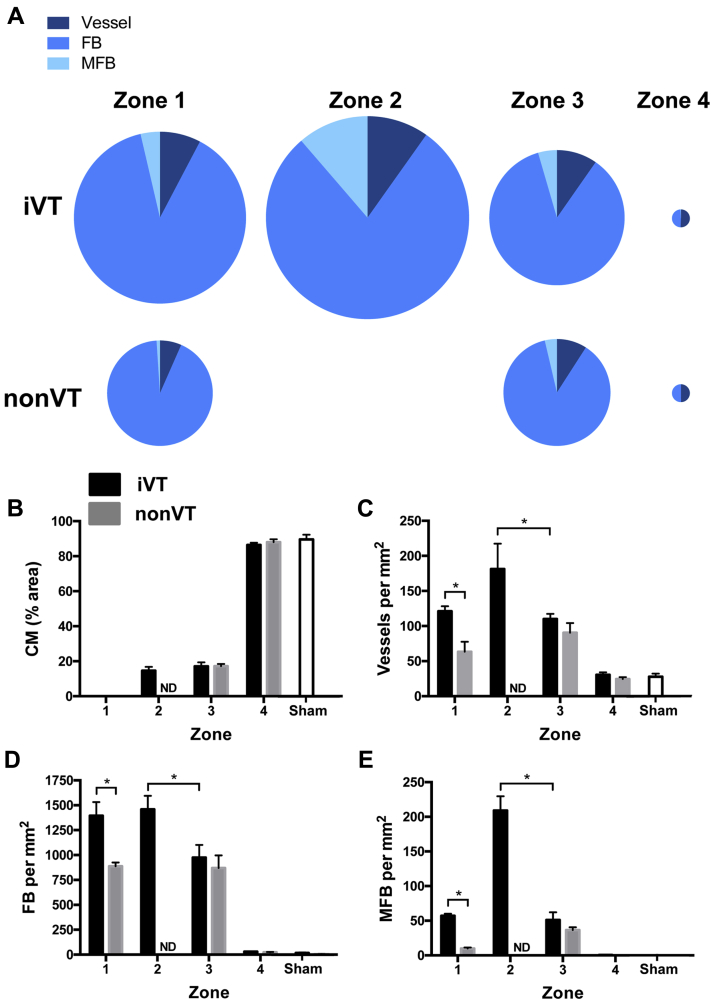
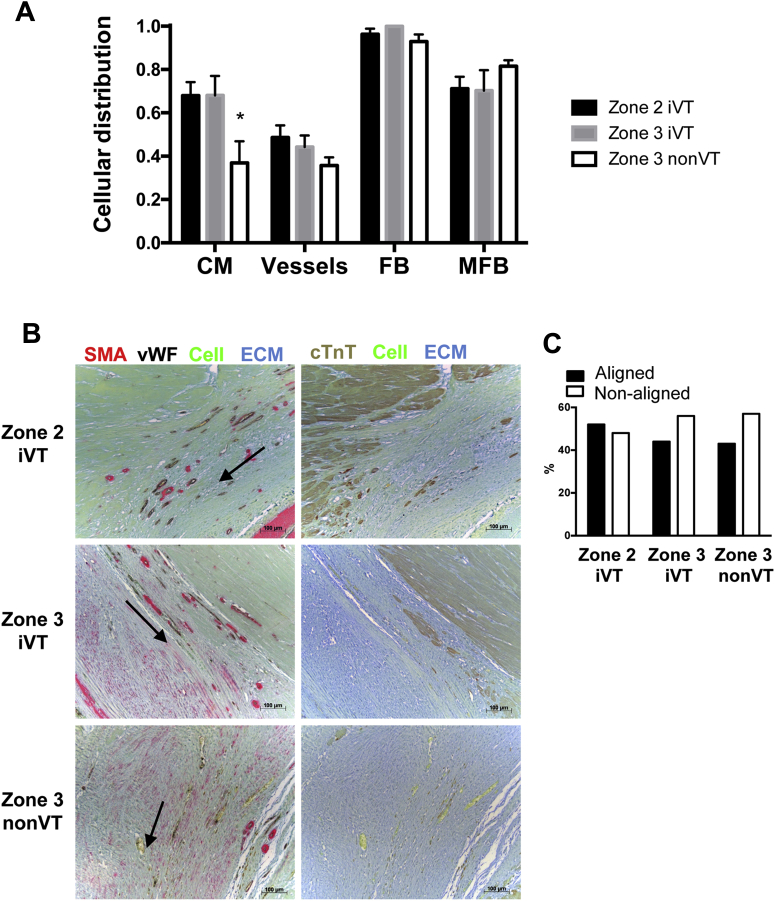
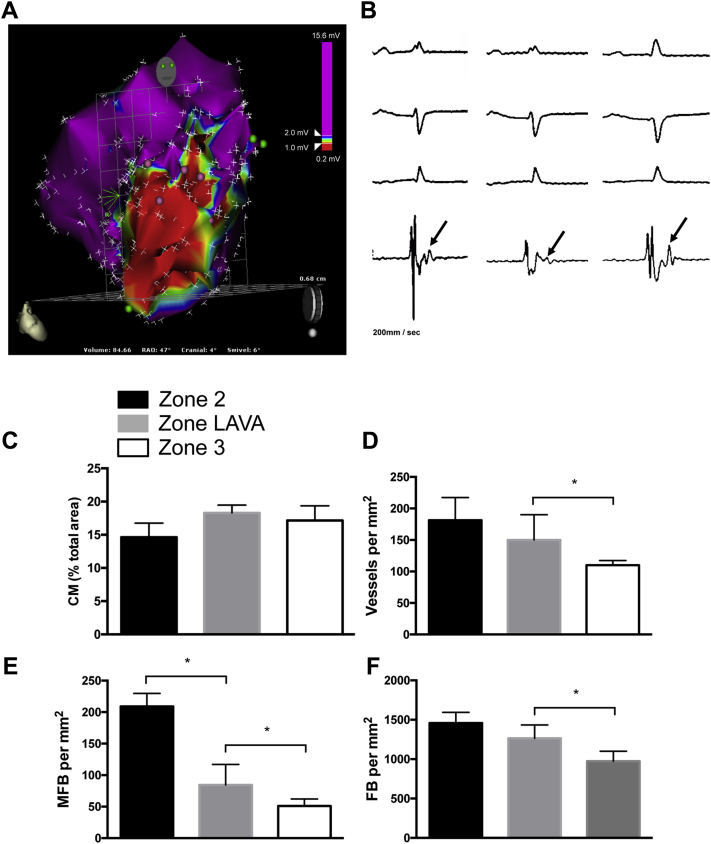
Results: In pigs with induced sustained monomorphic VT (mean cycle length: 353 ± 89 ms; n = 6) the area of scar that consisted of the BZ (i.e., between the normal and the low-voltage area identified by substrate mapping) was greater in VT-inducible hearts (iVT) than in noninducible hearts (non-VT) (p < 0.05). Scar in iVT hearts was characterized by MFB accumulation in the CI (>100 times that in normal myocardium and >5 times higher than that in the BZ in non-VT hearts) and by a 1.7-fold increase in blood vessel density within the dense scar region extending towards the CI. Sites of local abnormal ventricular activity potentials exhibited cellularity and vascularization that were intermediate to the CI in iVT and BZ in non-VT hearts.
Conclusions: The authors reported the first cellular analysis of the VT CI following an EP-based zonal analysis of iVT and non-VT hearts in pigs post-MI. The data suggested that VT susceptibility was defined by a remarkable number of MFB in the VT CI, which appeared to bridge the few remaining dispersed clusters of cardiomyocytes. These findings define the cellular substrate for the proarrhythmic slow conduction pathway.
Keywords: BZ, border zone; CI, critical isthmus; CM, cardiomyocytes; ECM, extracellular matrix; EP, electrophysiology; FB, fibroblasts; IHC, immunohistochemistry; LAD, left anterior descending; LAVA, local abnormal ventricular activity; MFB, myofibroblasts; MI, myocardial infarction; MRI, magnetic resonance imaging; VT; VT, ventricular tachycardia; Vim, vimentin; border zone; cTnT, cardiac troponin T; critical isthmus; iVT, inducible ventricular tachycardia; myocardial infarction; myofibroblasts; pig; vWF, von Willebrand factor; α-SMA, α-smooth muscle actin.
Figures

Comment in
-
Do Myofibroblasts Represent a Hidden Factor for Impaired Conduction and Tachyarrhythmia in Post-Myocardial Infarction?JACC Clin Electrophysiol. 2017 Jul;3(7):715-717. doi: 10.1016/j.jacep.2017.01.007. Epub 2017 Apr 26. JACC Clin Electrophysiol. 2017. PMID: 29759539 No abstract available.
References
-
- de Bakker J.M., van Capelle F.J., Janse M.J. Slow conduction in the infarcted human heart. 'Zigzag' course of activation. Circulation. 1993;88:915–926. - PubMed
-
- Stevenson W.G., Soejima K. Catheter ablation for ventricular tachycardia. Circulation. 2007;115:2750–2760. - PubMed
-
- Josephson M.E., Horowitz L.N., Farshidi A. Continuous local electrical activity. A mechanism of recurrent ventricular tachycardia. Circulation. 1978;57:659–665. - PubMed
-
- Stevenson W.G., Weiss J.N., Wiener I., Nademanee K. Slow conduction in the infarct scar: relevance to the occurrence, detection, and ablation of ventricular reentry circuits resulting from myocardial infarction. Am Heart J. 1989;117:452–467. - PubMed
-
- Stevenson W.G., Khan H., Sager P. Identification of reentry circuit sites during catheter mapping and radiofrequency ablation of ventricular tachycardia late after myocardial infarction. Circulation. 1993;88:1647–1670. - PubMed
Publication types
MeSH terms
Grants and funding
LinkOut - more resources
Full Text Sources
Other Literature Sources
Medical
Research Materials
Miscellaneous
