

HLA-DQB1*06 and breadth of Nef core region-specific T-cell response are associated with slow disease progression in antiretroviral therapy-naive Chinese HIV-1 subtype B patients
- PMID: 28771107
- PMCID: PMC5647954
- DOI: 10.1080/21645515.2017.1340138
HLA-DQB1*06 and breadth of Nef core region-specific T-cell response are associated with slow disease progression in antiretroviral therapy-naive Chinese HIV-1 subtype B patients
Abstract
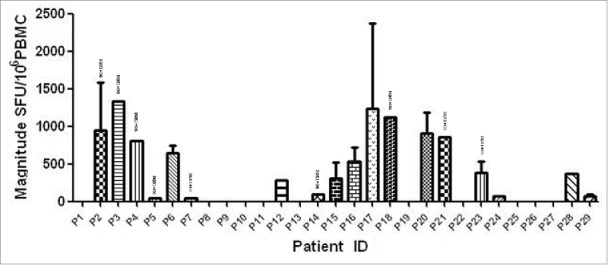
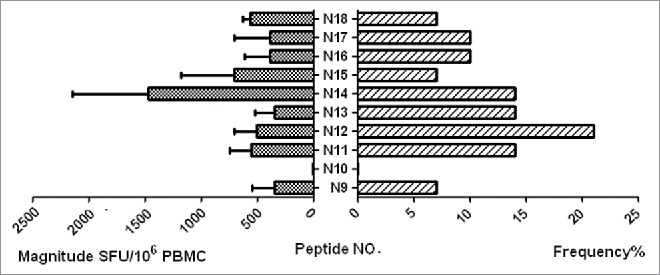
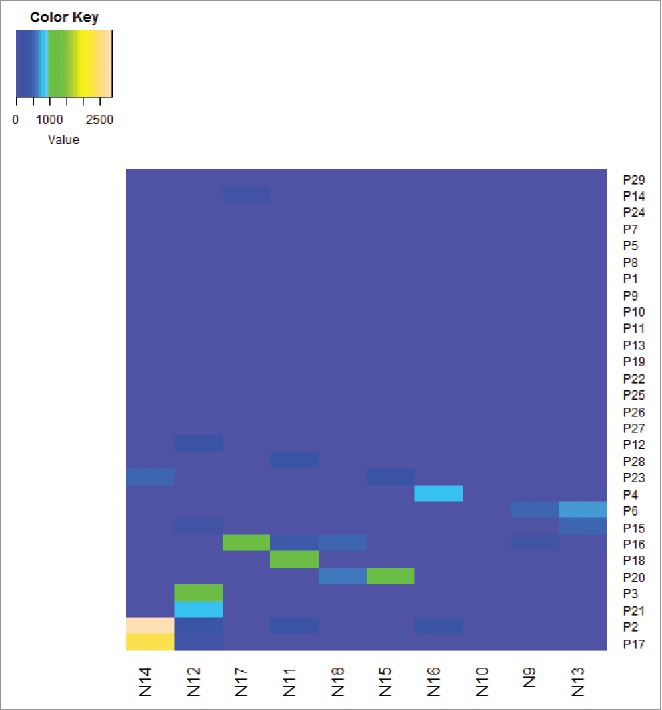
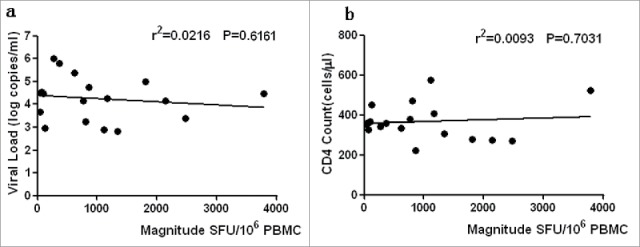
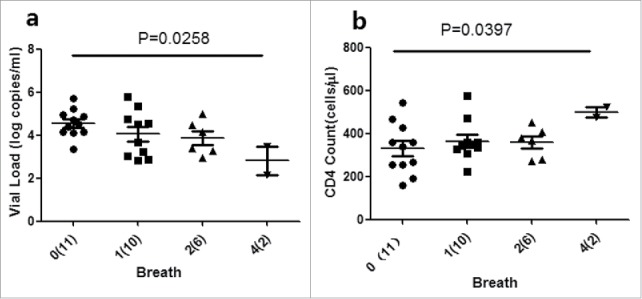
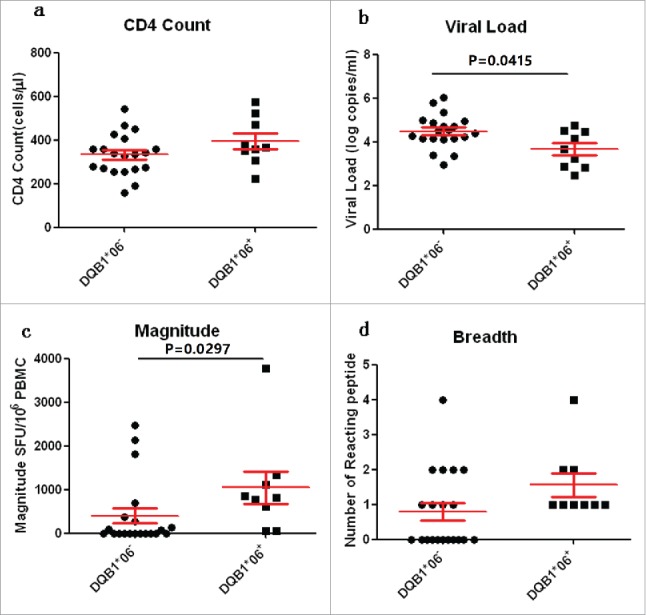
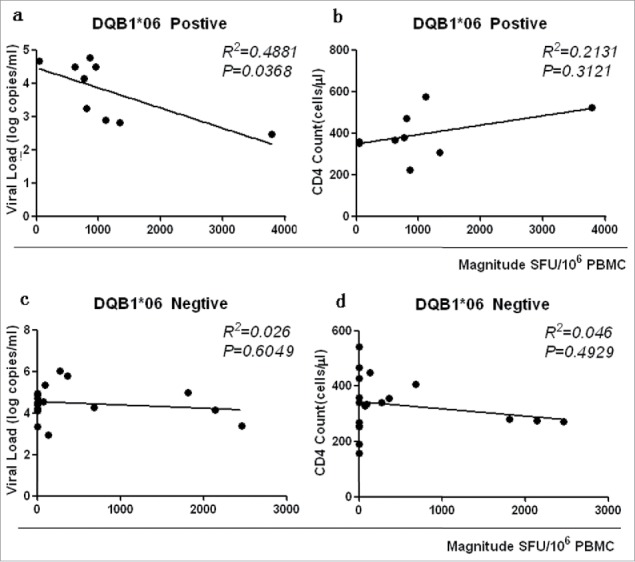
Vaccines still are an important way to prevent and treat acquired immunodeficiency syndrome (AIDS). 1 For developing an effective T cell-based AIDS vaccine, it is critical to define the human leukocyte antigen (HLA) type and epitope that elicit the most potent responses. This study involved 29 antiretroviral therapy-naive and chronic human immunodeficiency virus (HIV)-1 subtype B-infected individuals. A polymerase chain reaction-sequence-specific primer was used to detect the HLA typing, and the enzyme-linked immunospot assay to quantify the T-cell immune function. The results showed that the HLA-DQB1*06-positive group had higher CD4 counts and lower viral load (VL) compared with the HLA-DQB1*06-negative group; A higher magnitude of HIV-1-specific T-cell response and breadth were observed in the HLA-DQB1*06-positive group; the T-cell response was proportional to VL (R2 = 0.488, P = 0.0368) in the HLA-DQB1*06-positive group. The total T-cell responses to HIV-1 Nef core region were quantified at the single-peptide level. Nine (90%) peptides were recognized in 18 (62.1%) individuals. The breath of Nef core region-specific T-cell response was correlated positively with CD4+ T cell count and inversely with VL, which improved disease outcomes. These data revealed that HLA-DQB1*06 had a protective effect on the course of HIV-1 and T-cell targeting of certain specific Nef epitopes, contributing to HIV-1 suppression. The results suggested the potential use of HLA-DQB1*06 and Nef core region in HIV-1 T-cell vaccine design.
Keywords: HIV-1; HLA; NEF T-cell response; Vaccine.
Figures
Similar articles
-
Clinical Control of HIV-1 by Cytotoxic T Cells Specific for Multiple Conserved Epitopes.J Virol. 2015 May;89(10):5330-9. doi: 10.1128/JVI.00020-15. Epub 2015 Mar 4. J Virol. 2015. PMID: 25741000 Free PMC article.
-
Role of cytotoxic T-lymphocyte-mediated immune selection in a dominant human leukocyte antigen-B8-restricted cytotoxic T-lymphocyte epitope in Nef.J Acquir Immune Defic Syndr. 2008 Jun 1;48(2):133-41. doi: 10.1097/QAI.0b013e31816fdc4a. J Acquir Immune Defic Syndr. 2008. PMID: 18391752
-
HIV-specific CD8+ T cell responses to HXB2 Gag and Nef peptide pools in Chinese HIV/AIDS patients.Sci China C Life Sci. 2009 Sep;52(9):841-6. doi: 10.1007/s11427-009-0117-1. Epub 2009 Oct 6. Sci China C Life Sci. 2009. PMID: 19802743
-
The search for protection against HIV infection.Ann Epidemiol. 2009 Apr;19(4):250-2. doi: 10.1016/j.annepidem.2009.01.007. Ann Epidemiol. 2009. PMID: 19344863 Free PMC article. Review.
-
NKT cells in HIV-1 infection.Cell Res. 2008 Aug;18(8):817-22. doi: 10.1038/cr.2008.85. Cell Res. 2008. PMID: 18645582 Review.
Cited by
-
Association of HLADQ-B1 polymorphisms in three generations of chronic hepatitis B patients.Virus Res. 2023 Feb;325:199036. doi: 10.1016/j.virusres.2022.199036. Epub 2022 Dec 30. Virus Res. 2023. PMID: 36592642 Free PMC article.
-
Association between Human Leukocyte Antigen (HLA) DQB1*06 and HLA DQB1*03 and adverse outcomes in a group of critically ill patients with COVID-19 in Tunisia: a cross-sectional study.Pan Afr Med J. 2023 Jun 27;45:109. doi: 10.11604/pamj.2023.45.109.39956. eCollection 2023. Pan Afr Med J. 2023. PMID: 37719057 Free PMC article.
-
An atlas of immune cell transcriptomes in human immunodeficiency virus-infected immunological non-responders identified marker genes that control viral replication.Chin Med J (Engl). 2023 Nov 20;136(22):2694-2705. doi: 10.1097/CM9.0000000000002918. Epub 2023 Nov 1. Chin Med J (Engl). 2023. PMID: 37914674 Free PMC article.
-
The roles of HLA-DQB1 gene polymorphisms in hepatitis B virus infection.J Transl Med. 2018 Dec 18;16(1):362. doi: 10.1186/s12967-018-1716-z. J Transl Med. 2018. PMID: 30563535 Free PMC article.
References
-
- Cohen KW, Frahm N. Current views on the potential for development of a HIV vaccine. Expert Opin Biol Ther 2017; 17:295-303; PMID:28095712; https://doi.org/10.1080/14712598.2017.1282457 - DOI - PMC - PubMed
-
- Cotton LA, Kuang XT, Le AQ, Carlson JM, Chan B, Chopera DR, Brumme CJ, Markle TJ, Martin E, Shahid A, et al.. Genotypic and functional impact of HIV-1 adaptation to its host population during the North American epidemic. Plos Genet 2014; 10:e1004295; PMID:24762668; https://doi.org/10.1371/journal.pgen.1004295 - DOI - PMC - PubMed
-
- Payne R, Muenchhoff M, Mann J, Roberts HE, Matthews P, Adland E, Hempenstall A, Huang KH, Brockman M, Brumme Z, et al.. Impact of HLA-driven HIV adaptation on virulence in populations of high HIV seroprevalence. Proc Natl Acad Sci U S A 2014; 111:E5393-400; PMID:25453107; https://doi.org/10.1073/pnas.1413339111 - DOI - PMC - PubMed
-
- Goulder PJ, Walker BD. HIV and HLA class I: an evolving relationship. Immunity 2012; 37:426-40; PMID:22999948; https://doi.org/10.1016/j.immuni.2012.09.005 - DOI - PMC - PubMed
-
- Adland E, Paioni P, Thobakgale C, Laker L, Mori L, Muenchhoff M, Csala A, Clapson M, Flynn J, Novelli V, et al.. Discordant Impact of HLA on Viral Replicative Capacity and Disease Progression in Pediatric and Adult HIV Infection. Plos Pathog 2015; 11:e1004954; PMID:26076345; https://doi.org/10.1371/journal.ppat.1004954 - DOI - PMC - PubMed
MeSH terms
Substances
LinkOut - more resources
Full Text Sources
Other Literature Sources
Medical
Research Materials