

Use of fluorescence-detected sedimentation velocity to study high-affinity protein interactions
- PMID: 28771239
- PMCID: PMC7466938
- DOI: 10.1038/nprot.2017.064
Use of fluorescence-detected sedimentation velocity to study high-affinity protein interactions
Abstract
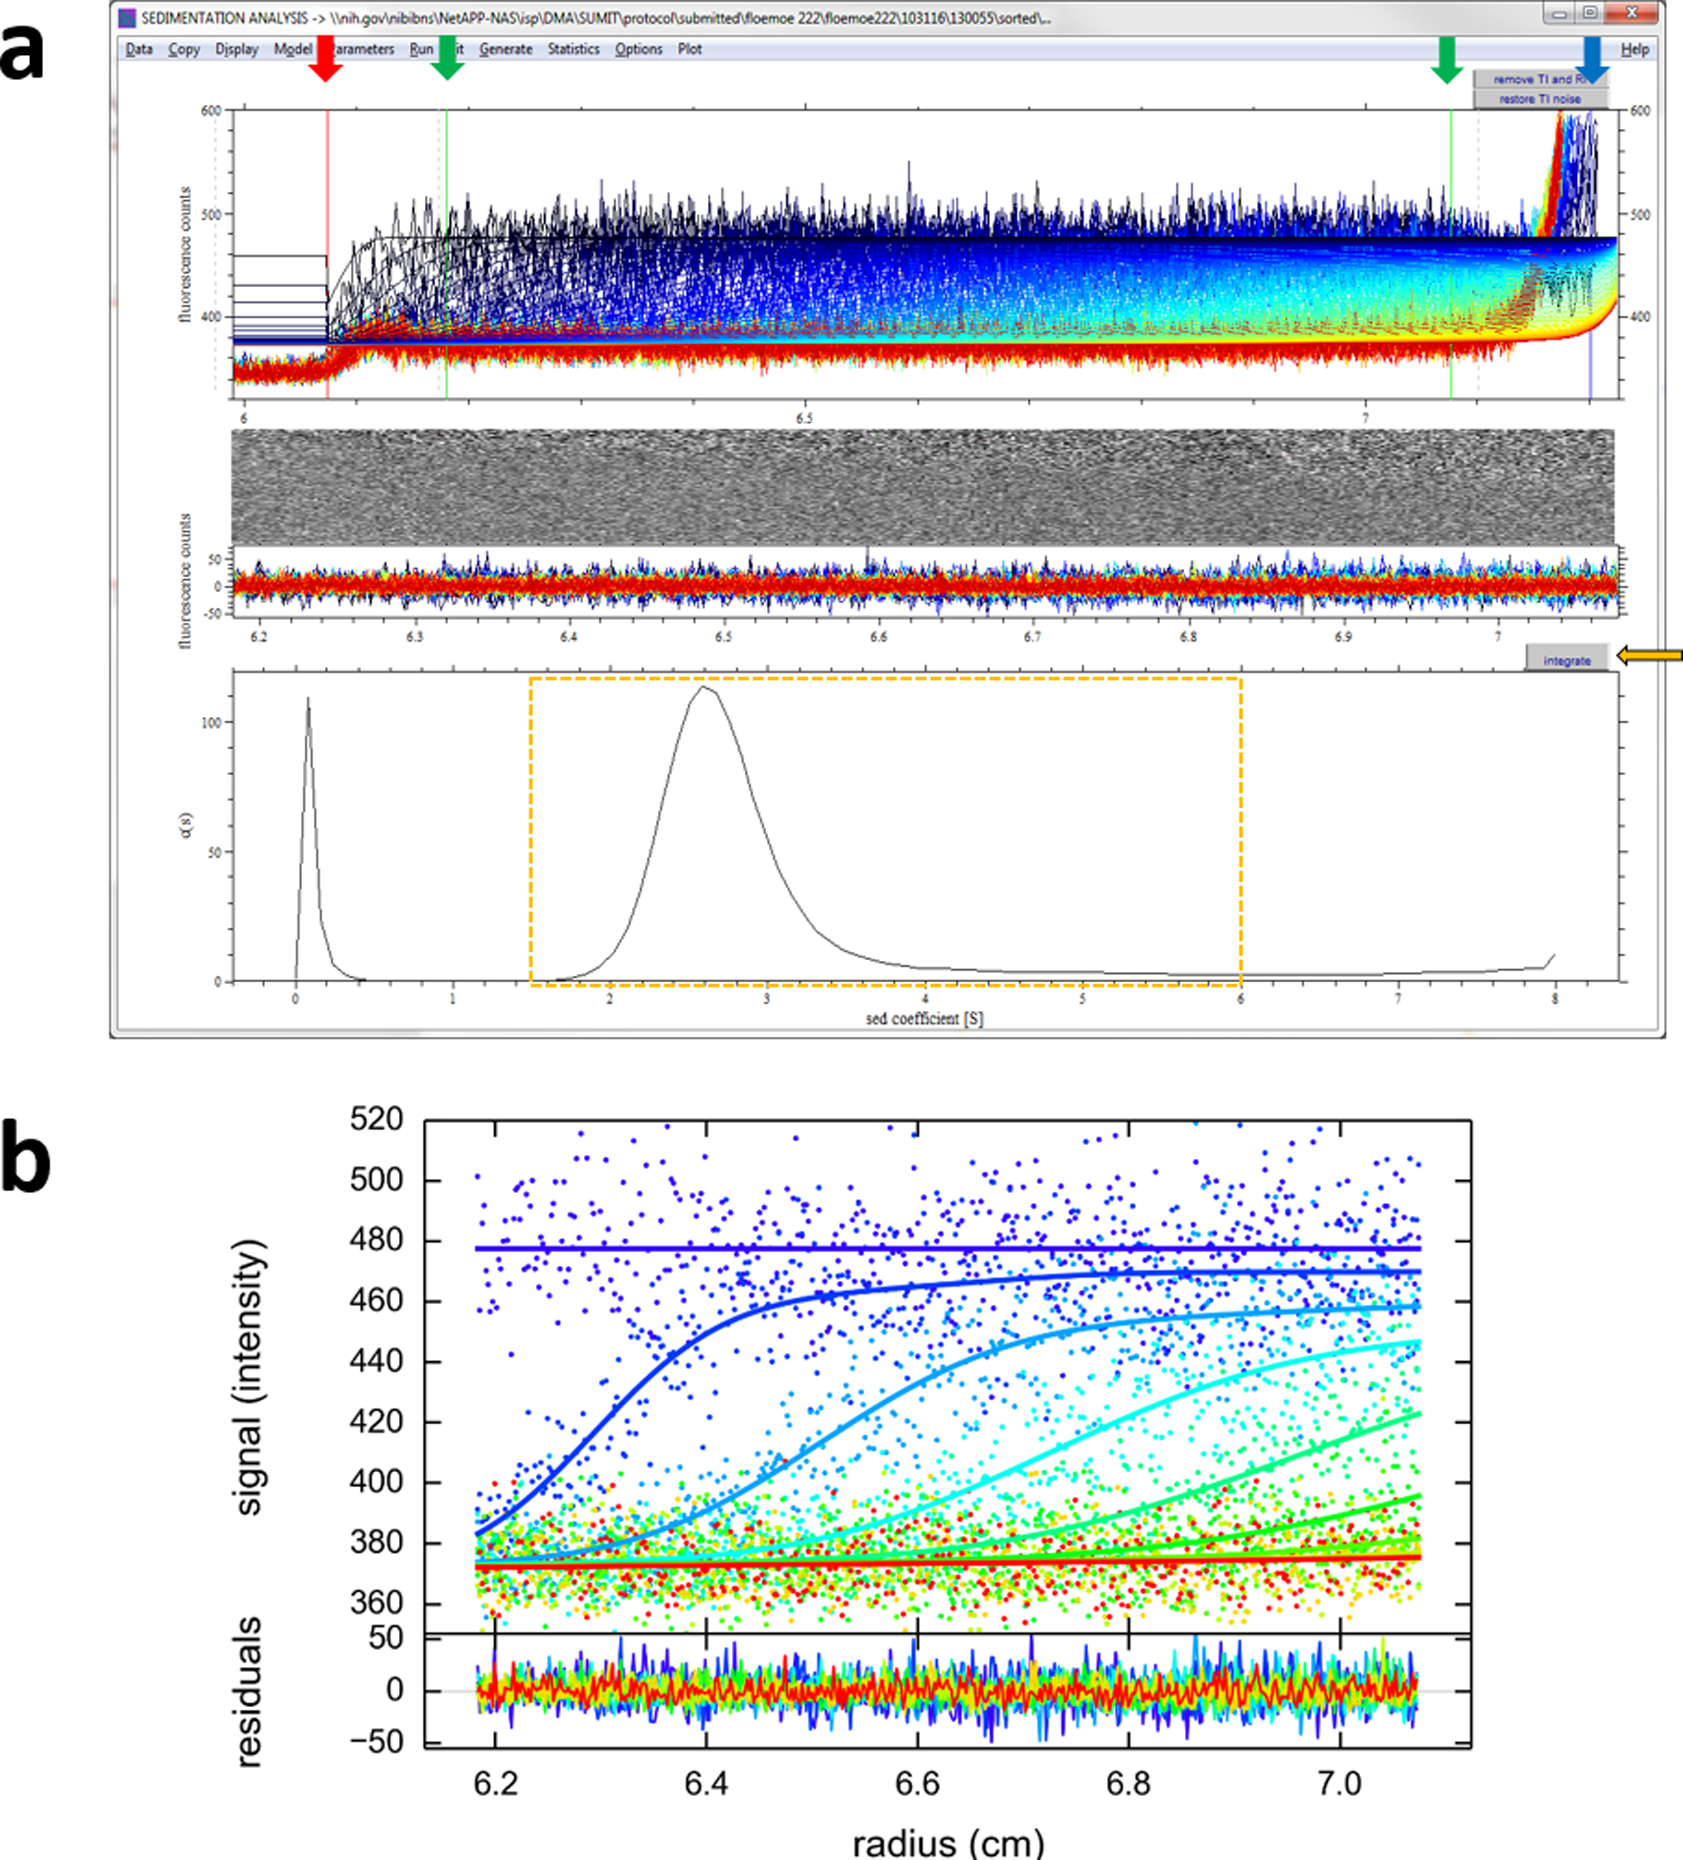
Sedimentation velocity (SV) analytical ultracentrifugation (AUC) is a classic technique for the real-time observation of free macromolecular migration in solution driven by centrifugal force. This enables the analysis of macromolecular mass, shape, size distribution, and interactions. Although traditionally limited to determination of the sedimentation coefficient and binding affinity of proteins in the micromolar range, the implementation of modern detection and data analysis techniques has resulted in marked improvements in detection sensitivity and size resolution during the past decades. Fluorescence optical detection now permits the detection of recombinant proteins with fluorescence excitation at 488 or 561 nm at low picomolar concentrations, allowing for the study of high-affinity protein self-association and hetero-association. Compared with other popular techniques for measuring high-affinity protein-protein interactions, such as biosensing or calorimetry, the high size resolution of complexes at picomolar concentrations obtained with SV offers a distinct advantage in sensitivity and flexibility of the application. Here, we present a basic protocol for carrying out fluorescence-detected SV experiments and the determination of the size distribution and affinity of protein-antibody complexes with picomolar KD values. Using an EGFP-nanobody interaction as a model, this protocol describes sample preparation, ultracentrifugation, data acquisition, and data analysis. A variation of the protocol applying traditional absorbance or an interference optical system can be used for protein-protein interactions in the micromolar KD value range. Sedimentation experiments typically take ∼3 h of preparation and 6-12 h of run time, followed by data analysis (typically taking 1-3 h).
Conflict of interest statement
COMPETING FINANCIAL INTERESTS
The authors declare no competing financial interests
Figures


References
-
- Gavin AC et al. Functional organization of the yeast proteome by systematic analysis of protein complexes. Nature 415, 141–147 (2002). - PubMed
-
- Schuck P, Zhao H, Brautigam CA & Ghirlando R Basic Principles of Analytical Ultracentrifugation. (CRC Press, 2015).
-
- Svedberg T The ultracentrifuge. Nobel Lecture. (1926). Available at: http://www.nobelprize.org/nobel_prizes/chemistry/laureates/1926/svedberg....
MeSH terms
Substances
Grants and funding
LinkOut - more resources
Full Text Sources
Other Literature Sources
Miscellaneous
