. 2017 Nov 17;6(11):2042-2055.
doi: 10.1021/acssynbio.6b00279. Epub 2017 Aug 23.

Multiplexing Engineered Receptors for Multiparametric Evaluation of Environmental Ligands

Affiliations

Multiplexing Engineered Receptors for Multiparametric Evaluation of Environmental Ligands

Rachel M Hartfield et al. ACS Synth Biol. .

Abstract

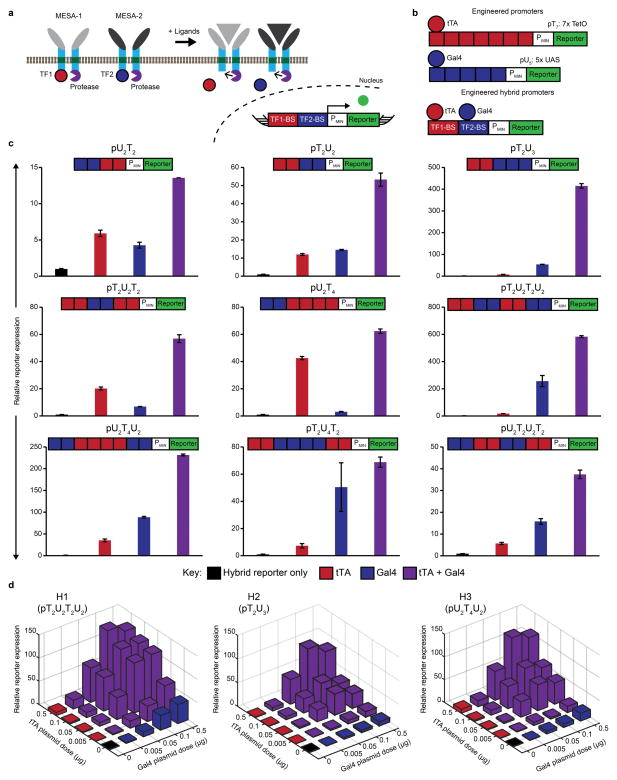
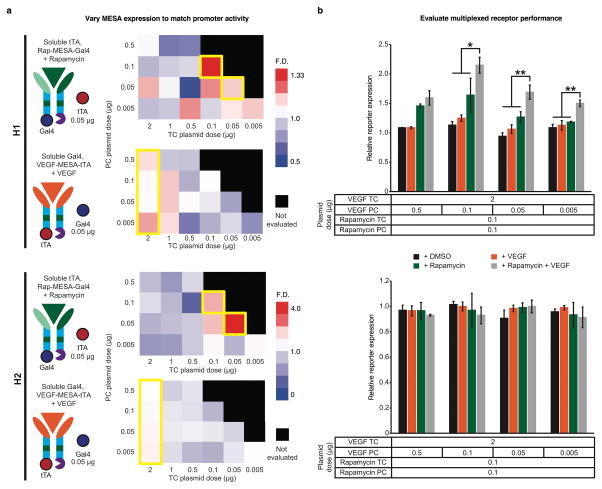
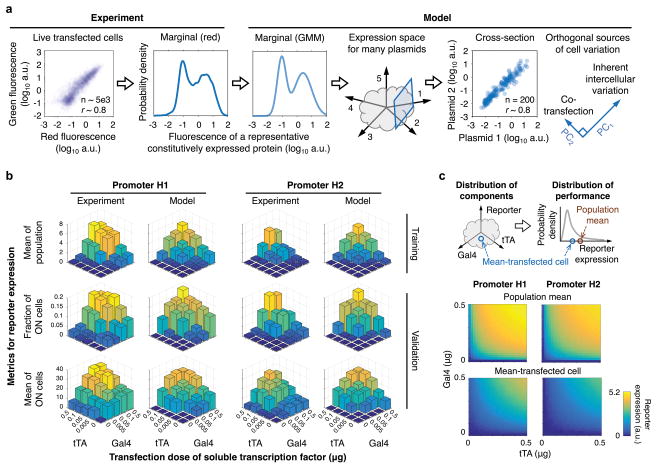
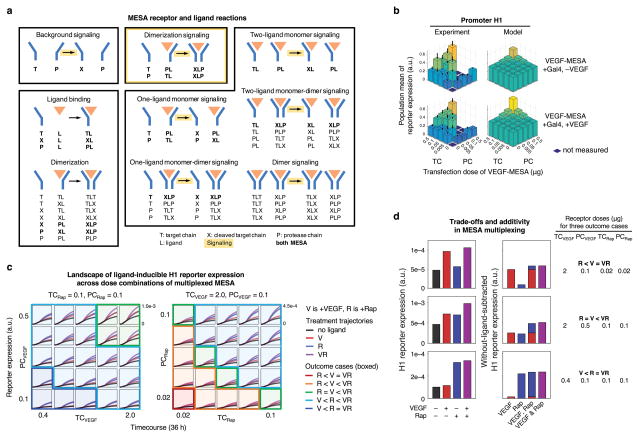
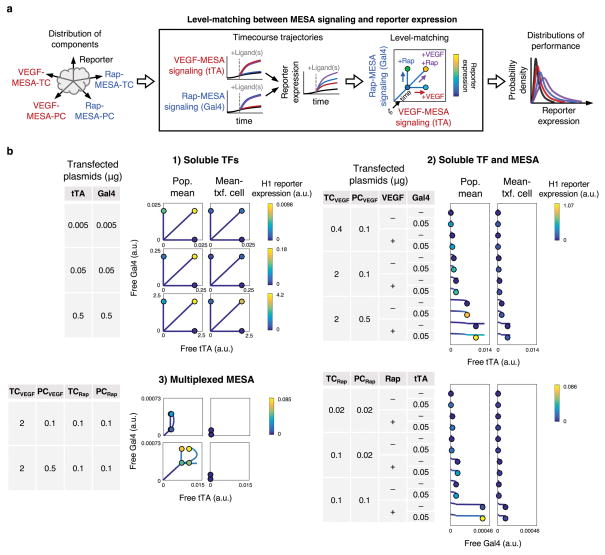
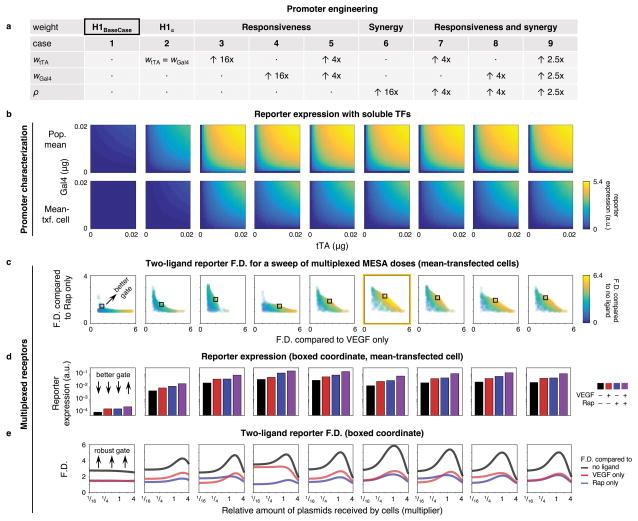
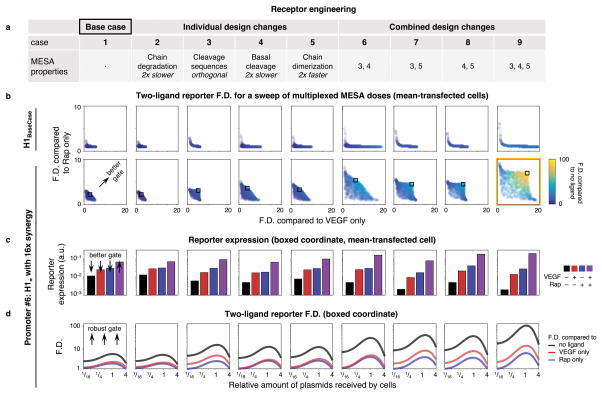
Engineered cell-based therapies comprise a promising, emerging biomedical technology. Broad utilization of this strategy will require new approaches for implementing sophisticated functional programs, such as sensing and responding to the environment in a defined fashion. Toward this goal, we investigated whether our self-contained receptor and signal transduction system (MESA) could be multiplexed to evaluate extracellular cues, with a focus on elucidating principles governing the integration of such engineered components. We first developed a set of hybrid promoters that exhibited AND gate activation by two transcription factors. We then evaluated these promoters when paired with two MESA receptors and various ligand combinations. Unexpectedly, although the multiplexed system exhibited distinct responses to ligands applied individually and in combination, the same synergy was not observed as when promoters were characterized with soluble transcription factors. Therefore, we developed a mechanistic computational model leveraging these observations, to both improve our understanding of how the receptors and promoters interface and to guide the design and implementation of future systems. Notably, the model explicitly accounts for the impact of intercellular variation on system characterization and performance. Model analysis identified key factors that affect the current receptors and promoters, and enabled an in silico exploration of potential modifications that inform the design of improved logic gates and their robustness to intercellular variation. Ultimately, this quantitative design-driven approach may guide the use and multiplexing of synthetic receptors for diverse custom biological functions beyond the case study considered here.

Keywords: biosensor; computational model; genetic circuit; intercellular variation; mammalian; receptor engineering.


Figures

Figure 1
Figure 1. Design and evaluation of hybrid reporters
(a) In the proposed strategy for multiplexing MESA, two receptors each sense a distinct ligand, undergo dimerization and enzymatic trans-cleavage, and release a transcription factor (TF1, TF2) that enters the nucleus and induces target gene expression. A hybrid promoter is regulated by both TF1 and TF2 to enable logical evaluation of the ligands. In the proposed single-layer transcriptional AND gate, the reporter is expressed if and only if both ligands (gray and black triangles) are sensed. (b) Hybrid promoters were designed using the modular TetO (red) and UAS (blue) binding domains for tTA and Gal4, respectively. Canonical single-TF promoters are illustrated for comparison. (c) Hybrid constructs were evaluated by cotransfection of plasmids (0.5 μg per plasmid) for constitutively expressed soluble tTA and Gal4 and quantification of reporter expression (fluorescence) by flow cytometry. Relative reporter expression was calculated independently for each promoter by dividing YFP mean fluorescence intensity (MFI) with either or both TFs by the MFI without TF. Experiments were conducted in biological triplicate, and error bars represent one standard deviation. (d) For three reporters from (b) termed H1, H2, and H3 as indicated, promoter activity was characterized across tTA and Gal4 plasmid dose combinations, and data were analyzed as in (c).
Figure 2
Figure 2. Multiplexed receptor implementation
(a) A complementation assay was conducted for each receptor-promoter pair, in which ligand-induced F.D. was determined across TC and PC dose combinations with the complementary soluble TF expressed constitutively and in relative excess. In the heatmaps (see Supporting Information Figure S4 for details), yellow boxes outline conditions with the highest measured F.D. Data were analyzed as in Figure 1. (b) MESA doses identified based on (a) were used to implement multiplexed receptors. Relative DsRed reporter expression was calculated independently for each promoter by dividing the DsRed mean fluorescence intensity (MFI) with MESA by the MFI without MESA, such that cells transfected with reporter only would have a value of one on this scale. Experiments were conducted in biological triplicate, and error bars represent one standard deviation. An ANOVA statistical test was utilized to compare the two-ligand case to all other cases (*p ≤ 0.05, **p ≤ 0.01).
Figure 3
Figure 3. A model that accounts for cell variation to explain heterogeneous promoter activity
(a) A statistical model was formulated and trained on experimental data to account for inherent intercellular variation in transcription rate, translation rate, and transfection efficiency. The marginal distribution was modeled using a Gaussian mixture model (GMM). The resulting in silico population exhibits the expected covariance between plasmids for a multi-plasmid transfection (inferred from constitutive expression of fluorescent proteins in experimental cases). Principal component analysis identified two sources of variability: the major contributor (ranging from 90% for two plasmids to 84% for five plasmids) is inherent variation, and the minor contributor is variation due to cotransfection of multiple plasmids. The Pearson correlation coefficient r in the cross-section is 0.8 on a linear scale and 0.9 on a log10 scale. (b) A dynamical model for TF expression and hybrid promoter activity in a transfected cell population was formulated and trained on mean average data in Figure 1d for various tTA and Gal4 plasmid dose combinations. (c) The promoter model maps from a three-dimensional plasmid transfection distribution onto a one-dimensional reporter expression distribution. The distributions depict the reporter expression for hybrid promoters H1 and H2, when quantified for the population mean (i.e., mean reporter expression for all transfected cells) and mean-transfected cell (i.e., a cell that receives the mean amount of each plasmid).
Figure 4
Figure 4. A dynamical model that links MESA receptor signaling to promoter activity
(a) This illustration summarizes the species and reactions in the MESA model. There are 28 types of reactions, which are grouped into nine categories (named) and four modalities (boxed). Reactions that occur for both MESA (Rap-MESA and VEGF-MESA) are bolded, categories that release a soluble TF are highlighted (yellow arrow), and the modality for canonical ligand-induced signaling is highlighted (yellow box). For the four modalities: (1) background signaling is the only one that occurs in the absence of ligand, (2) ligand-binding and dimerization involve ligand but do not directly result in signaling, (3) dimerization signaling is the canonical ligand-induced pathway, and (4) the remaining categories involve, but are not directly mediated by, the ligand and are subject to crosstalk. (b) Data that were used to determine F.D. in Figure 2a are compared to simulated outcomes for a similar in silico experiment with VEGF-MESA, constitutive soluble Gal4, and promoter H1, with VEGF (lower panel) and without VEGF (upper panel). Since reporter expression is quantified in units that differ between experiments and simulations, experimental data (originally in flow cytometry-specific units) were linearly scaled to enable a more direct visual comparison with simulation results. (c) Time course H1 reporter trajectories across TC and PC doses are shown for the mean-transfected cell, +/− each ligand treatment (V, VEGF; R, Rap; VR, VEGF and Rap). In the left panel, VEGF-MESA doses are varied while Rap-MESA dose is constant, and in the right panel, Rap-MESA doses are varied while VEGF-MESA dose is constant. Simulations are grouped into five outcome cases (represent by box shading and outline color) based on the rank-ordered expression with each ligand treatment. (d) Three cases from (c) are examined in more detail. The left panel shows the absolute reporter expression, and the right panel shows ligand-induced reporter expression after the background (without ligand) is subtracted, to illustrate the additive ligand-induced response to these ligands. There exists a trade-off for two-ligand induced signaling, in which adjustments to the MESA plasmid dose that increase the F.D. compared to one ligand also decrease F.D. compared to the other ligand.
Figure 5
Figure 5. Level-matching between receptor signaling and the promoter
(a) Level-matching is depicted by yo-yo plots, which represent the trajectories of free TF and reporter variables together and without using a time axis. Reporter expression across the time course (the “string”) and at the circled endpoint (the “yo-yo”, corresponding to the time point for experimental measurements) is indicated using a color scale. Each profile begins at the origin, proceeds through state space depending on plasmid doses and treatment with either, both, or no ligand, and concludes at the circled coordinate. (b) Quantitative outcomes for each ligand treatment are shown for varied plasmid doses in three scenarios: (1) two constitutively soluble TFs, (2) one constitutively soluble TF and one MESA receptor, and (3) two MESA receptors. TFs are in comparable arbitrary units (a.u.), and reporter expression is color-coded by reporter-specific a.u. Profiles in which the circled coordinate differs from the maximum coordinate along a given axis indicate that the trajectory of the corresponding TF peaks and decreases during the timecourse. Diagonal lines indicate that the trajectories of both TFs are changing proportionately, curved lines indicate that both are changing and in a way that is not proportional, and vertical and horizontal lines indicate that one is changing while the other has reached a steady state. In the second scenario, only the TF released from MESA (and not the constitutively soluble TF) is plotted, and a slight downward curvature for the 36 h time course is shown for clarity. In the third scenario, ideal level-matching for AND gate functionality would be conferred by TF trajectories that lead to much higher reporter expression with both ligands compared to either or no ligand. In such a scenario, the upper-right yo-yo would be the only one of the four that is able to leverage the synergistic regime of the hybrid promoter.
Figure 6
Figure 6. Promoter engineering to improve AND gate performance
(a) Hypothetical promoters were produced in silico and vary in responsiveness to each TF and/or in synergy. Multipliers for transcriptional weight parameters in cases #3–9 are in comparison to case #2, in which tTA responsiveness is set equal to Gal4 responsiveness. Case #2 is a responsiveness-balanced version of H1 (base case, #1). (b) Promoters were characterized by reporter expression for the population mean (top row) and the mean-transfected cell, using doses of constitutively soluble TFs that match the inferred range of TFs released in MESA signaling. (c) Multiplexed MESA performance with each promoter was assessed by a sweep of 1,000 receptor plasmid dose combinations (0 to 0.5 μg per plasmid), each of which is represented by a single data point on each plot. Plots report three performance metrics: two-ligand induced F.D. calculated with respect to (1) treatment with VEGF alone (x-axis), (2) treatment with rapamycin (y-axis), and (3) no ligand (color-coded). In each case, these metrics are calculated for the mean-transfected cell in a population. Better AND gates are realized towards the upper-right region of each plot. All three F.D. metrics cannot be maximized simultaneously, as evidenced by the absence of outcomes in the upper-right-most corner, since choosing plasmid doses that maximize any one metric comes at the expense of decreasing one or both others. Therefore, the best possible AND gate functionality requires each metric to be maximized only to an extent, and in a way that balances the trade-off with the others. A representative ideal instance for each case is indicated by a box and is examined further in (d) and (e). The best promoter overall (#6) is outlined in yellow. (d) A comparison of reporter expression for instances identified by the boxes in (c), still using the mean-transfected cell. (e) Effects of cell variation on the three F.D. metrics. X-axis numbers are multipliers for the relative amounts of plasmids received by cells (determined without the variance from the minor principal component that is due to cotransfection), such that a value of “1” is the mean-transfected cell. The multipliers 1/16, 1/4, 1, and 4 correspond to the 23rd, 45th, 62nd, and 85th percentiles, respectively, for amounts of plasmids received by a cell in a transfected population, as determined from the intercellular variation model. Each line represents the F.D. outcomes from 31 different simulations of increasing plasmid dose, from left to right. Greater robustness to intercellular variation (in context of the specific plasmid doses for each of the nine cases) is indicated by increases in F.D. across a wider range of x-axis values.
Figure 7
Figure 7. Receptor engineering to improve AND gate performance
(a) Hypothetical modifications to MESA receptor kinetics and design features were produced in silico, in reference to the MESA base case (#1). Receptor cases #2–5 are modifications to #1, and #6–9 are combinations of the modifications in #3–5. (b) Multiplexed MESA performance was assessed and plotted as described in Figure 6c. Outcomes are shown for two promoters: base case (promoter #1, upper row) and a high-performing promoter from Figure 6 (promoter #6, lower row). For promoter #6, a representative ideal instance for each receptor modification is indicated by a box and is examined further in (c) and (d), as described for similar investigations of promoter variations in Figure 6. The best receptor overall (#9) is outlined in yellow.

Similar articles

Cited by

References

    1. Fesnak AD, June CH, Levine BL. Engineered T cells: the promise and challenges of cancer immunotherapy. Nat Rev Cancer. 2016;16(9):566–81. - PMC - PubMed
    1. Schwarz KA, Leonard JN. Engineering cell-based therapies to interface robustly with host physiology. Adv Drug Deliv Rev. 2016 - PMC - PubMed
    1. Fedorov VD, Themeli M, Sadelain M. PD-1- and CTLA-4-based inhibitory chimeric antigen receptors (iCARs) divert off-target immunotherapy responses. Sci Transl Med. 2013;5(215):215ra172. - PMC - PubMed
    1. Kloss CC, Condomines M, Cartellieri M, Bachmann M, Sadelain M. Combinatorial antigen recognition with balanced signaling promotes selective tumor eradication by engineered T cells. Nat Biotechnol. 2013;31(1):71–5. - PMC - PubMed
    1. Roybal KT, Rupp LJ, Morsut L, Walker WJ, McNally KA, Park JS, Lim WA. Precision Tumor Recognition by T Cells With Combinatorial Antigen-Sensing Circuits. Cell. 2016;164(4):770–9. - PMC - PubMed

Publication types