Comprehensive analysis of nucleocytoplasmic dynamics of mRNA in Drosophila cells
- PMID: 28771467
- PMCID: PMC5557608
- DOI: 10.1371/journal.pgen.1006929
Comprehensive analysis of nucleocytoplasmic dynamics of mRNA in Drosophila cells
Abstract
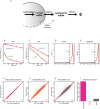
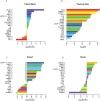
Eukaryotic mRNAs undergo a cycle of transcription, nuclear export, and degradation. A major challenge is to obtain a global, quantitative view of these processes. Here we measured the genome-wide nucleocytoplasmic dynamics of mRNA in Drosophila cells by metabolic labeling in combination with cellular fractionation. By mathematical modeling of these data we determined rates of transcription, export and cytoplasmic decay for 5420 genes. We characterized these kinetic rates and investigated links with mRNA features, RNA-binding proteins (RBPs) and chromatin states. We found prominent correlations between mRNA decay rate and transcript size, while nuclear export rates are linked to the size of the 3'UTR. Transcription, export and decay rates are each associated with distinct spectra of RBPs. Specific classes of genes, such as those encoding cytoplasmic ribosomal proteins, exhibit characteristic combinations of rate constants, suggesting modular control. Binding of splicing factors is associated with faster rates of export, and our data suggest coordinated regulation of nuclear export of specific functional classes of genes. Finally, correlations between rate constants suggest global coordination between the three processes. Our approach provides insights into the genome-wide nucleocytoplasmic kinetics of mRNA and should be generally applicable to other cell systems.
Conflict of interest statement
The authors have declared that no competing interests exist.
Figures


Similar articles
-
Genome-wide analysis of nuclear mRNA export pathways in Drosophila.EMBO J. 2003 May 15;22(10):2472-83. doi: 10.1093/emboj/cdg233. EMBO J. 2003. PMID: 12743041 Free PMC article.
-
Genome-wide analysis of RNA-protein interactions illustrates specificity of the mRNA export machinery.Nat Genet. 2003 Feb;33(2):155-61. doi: 10.1038/ng1080. Epub 2003 Jan 13. Nat Genet. 2003. PMID: 12524544
-
REF1/Aly and the additional exon junction complex proteins are dispensable for nuclear mRNA export.J Cell Biol. 2002 Nov 25;159(4):579-88. doi: 10.1083/jcb.200207128. Epub 2002 Nov 18. J Cell Biol. 2002. PMID: 12438415 Free PMC article.
-
Understanding nuclear mRNA export: Survival under stress.Mol Cell. 2024 Oct 3;84(19):3681-3691. doi: 10.1016/j.molcel.2024.08.028. Mol Cell. 2024. PMID: 39366354 Review.
-
A novel family of nuclear transport receptors mediates the export of messenger RNA to the cytoplasm.Eur J Cell Biol. 2002 Nov;81(11):577-84. doi: 10.1078/0171-9335-00273. Eur J Cell Biol. 2002. PMID: 12498157 Review.
Cited by
-
Adapting INTACT to analyse cell-type-specific transcriptomes and nucleocytoplasmic mRNA dynamics in the Arabidopsis embryo.Plant Reprod. 2019 Mar;32(1):113-121. doi: 10.1007/s00497-018-0347-0. Epub 2018 Nov 15. Plant Reprod. 2019. PMID: 30430248
-
Nuclear export is a limiting factor in eukaryotic mRNA metabolism.PLoS Comput Biol. 2024 May 16;20(5):e1012059. doi: 10.1371/journal.pcbi.1012059. eCollection 2024 May. PLoS Comput Biol. 2024. PMID: 38753883 Free PMC article.
-
Rapid nuclear deadenylation of mammalian messenger RNA.iScience. 2022 Dec 28;26(1):105878. doi: 10.1016/j.isci.2022.105878. eCollection 2023 Jan 20. iScience. 2022. PMID: 36691625 Free PMC article.
-
An APEX2 proximity ligation method for mapping interactions with the nuclear lamina.J Cell Biol. 2021 Jan 4;220(1):e202002129. doi: 10.1083/jcb.202002129. J Cell Biol. 2021. PMID: 33306092 Free PMC article.
-
Nanodynamo quantifies subcellular RNA dynamics revealing extensive coupling between steps of the RNA life cycle.Nat Commun. 2024 Sep 4;15(1):7725. doi: 10.1038/s41467-024-51917-2. Nat Commun. 2024. PMID: 39231948 Free PMC article.
References
-
- Dolken L., et al. High-resolution gene expression profiling for simultaneous kinetic parameter analysis of RNA synthesis and decay. RNA, 2008. 14(9): p. 1959–72. doi: 10.1261/rna.1136108 - DOI - PMC - PubMed
-
- Rabani M., et al. Metabolic labeling of RNA uncovers principles of RNA production and degradation dynamics in mammalian cells. Nat Biotechnol, 2011. 29(5): p. 436–42. doi: 10.1038/nbt.1861 - DOI - PMC - PubMed
-
- Bhatt D.M., et al. Transcript dynamics of proinflammatory genes revealed by sequence analysis of subcellular RNA fractions. Cell, 2012. 150(2): p. 279–90. doi: 10.1016/j.cell.2012.05.043 - DOI - PMC - PubMed
-
- Eser P., et al. Periodic mRNA synthesis and degradation co-operate during cell cycle gene expression. Mol Syst Biol, 2014. 10: p. 717 doi: 10.1002/msb.134886 - DOI - PMC - PubMed
MeSH terms
Substances
LinkOut - more resources
Full Text Sources
Other Literature Sources
Molecular Biology Databases

