. 2017 Aug 3;11(8):e0005694.
doi: 10.1371/journal.pntd.0005694. eCollection 2017 Aug.

Increasing airline travel may facilitate co-circulation of multiple dengue virus serotypes in Asia

Affiliations

Increasing airline travel may facilitate co-circulation of multiple dengue virus serotypes in Asia

Huaiyu Tian et al. PLoS Negl Trop Dis. .

Abstract

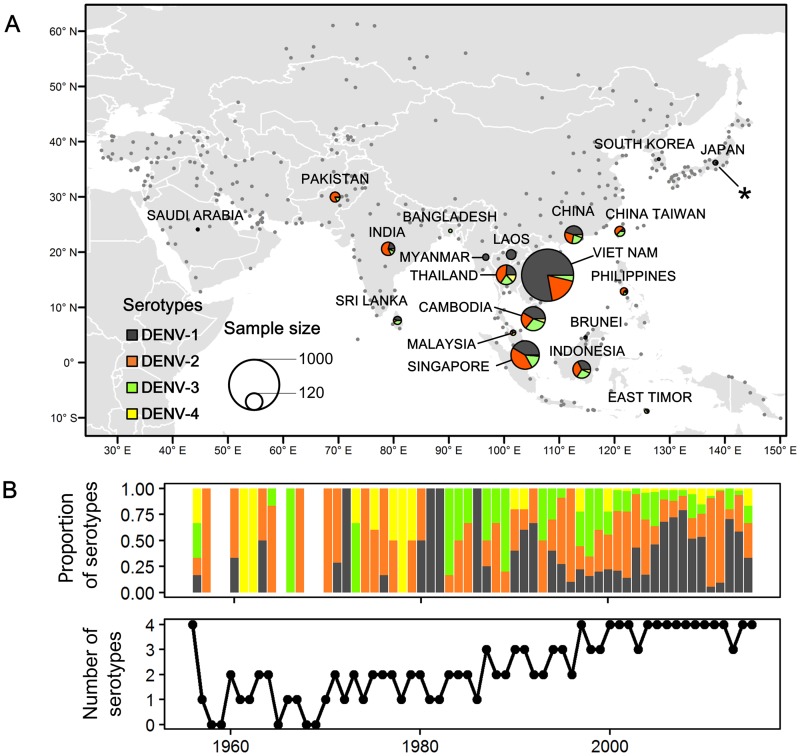
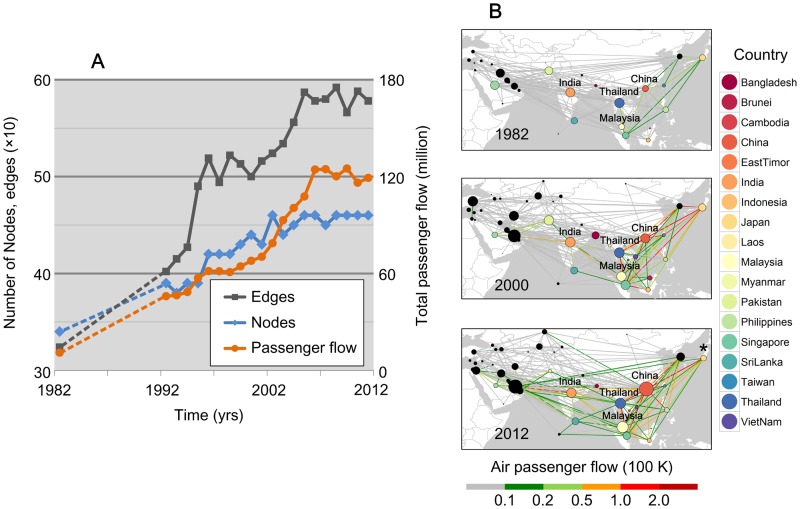
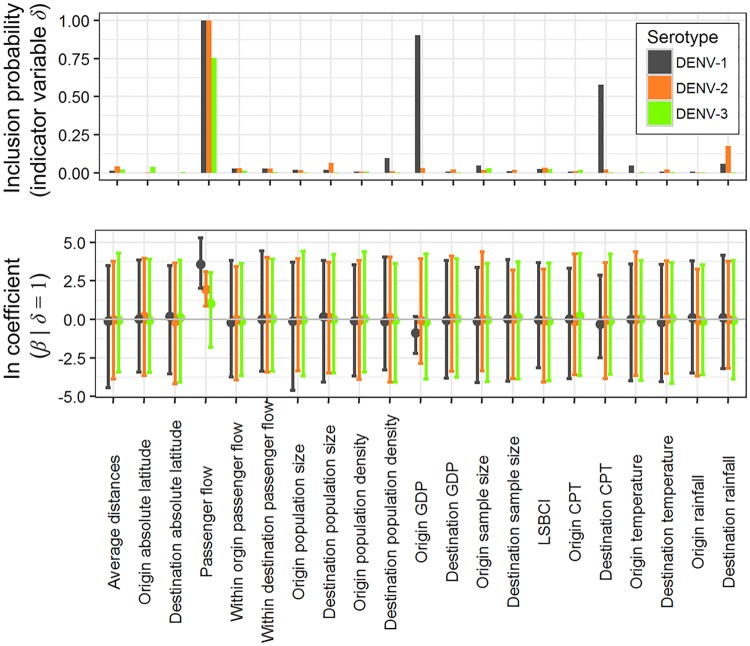
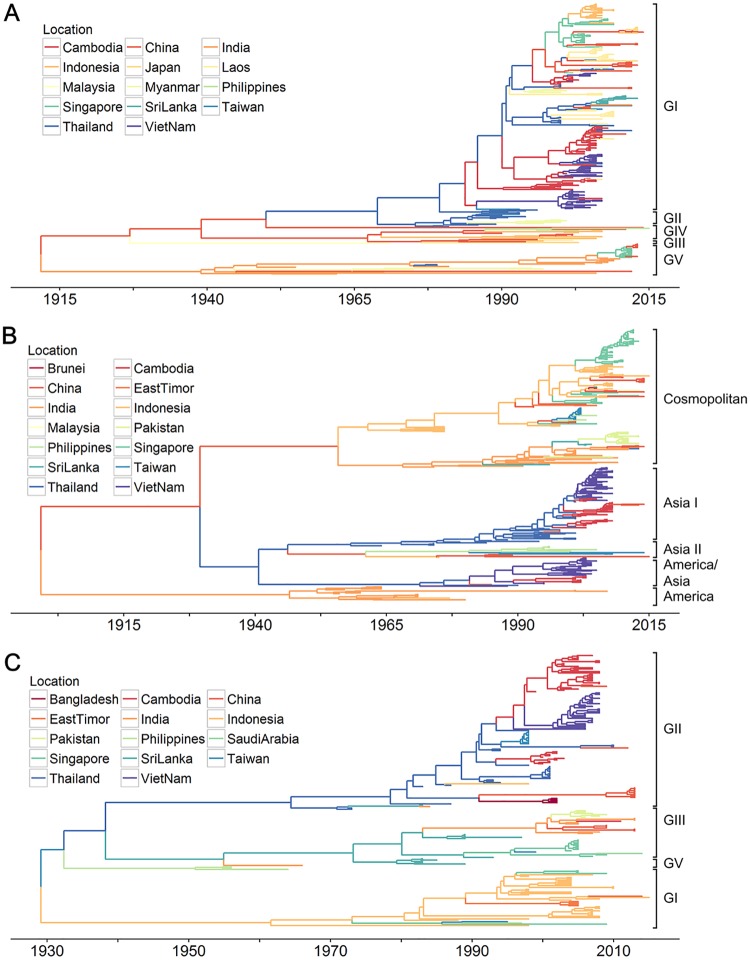
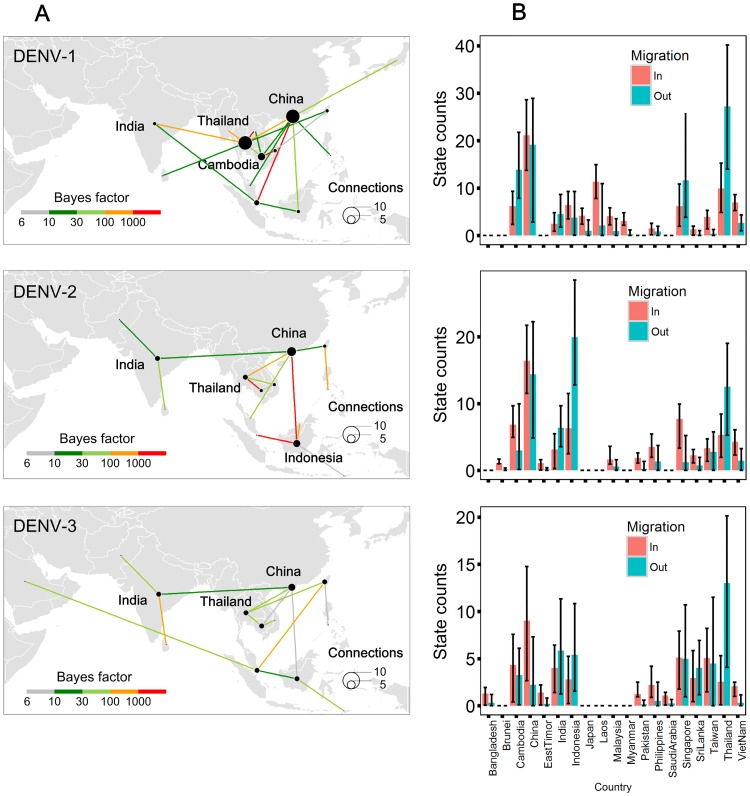
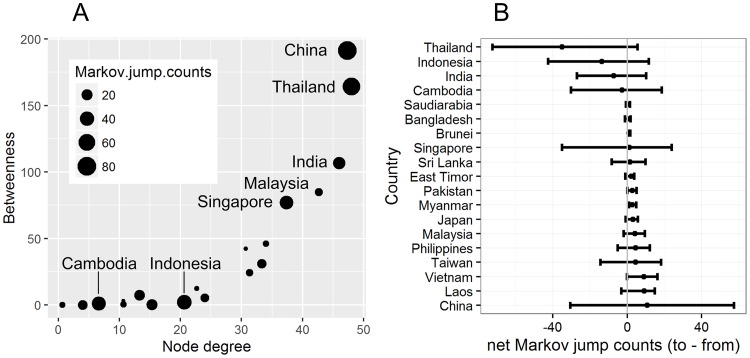
The incidence of dengue has grown dramatically in recent decades worldwide, especially in Southeast Asia and the Americas with substantial transmission in 2014-2015. Yet the mechanisms underlying the spatio-temporal circulation of dengue virus (DENV) serotypes at large geographical scales remain elusive. Here we investigate the co-circulation in Asia of DENV serotypes 1-3 from 1956 to 2015, using a statistical framework that jointly estimates migration history and quantifies potential predictors of viral spatial diffusion, including socio-economic, air transportation and maritime mobility data. We find that the spread of DENV-1, -2 and -3 lineages in Asia is significantly associated with air traffic. Our analyses suggest the network centrality of air traffic hubs such as Thailand and India contribute to seeding dengue epidemics, whilst China, Cambodia, Indonesia, and Singapore may establish viral diffusion links with multiple countries in Asia. Phylogeographic reconstructions help to explain how growing air transportation networks could influence the dynamics of DENV circulation.


Conflict of interest statement

The authors have declared that no competing interests exist.

Figures

Fig 1
Fig 1. Co-circulation of dengue virus serotypes in Asia.
(A). Locations of available viral sequences (within regions defined by sampling effort) and airports. Circle areas are proportional to the number of genetic sequences from a particular geographic location and for a given serotype (dark grey: DENV-1, orange: DENV-2, green: DENV-3, and yellow: DENV-4). Grey dots represent the airports for which passenger flux data was used in the analysis. Sequences obtained from patients in Japan, 2014 are indicated by asterisk. (B) The upper panel shows the proportion of sequences from each serotype per year, while the lower panel shows the number of serotypes isolated per year in Asia. Co-occurrence of multiple serotypes in a single year has become increasingly frequent.
Fig 2
Fig 2. Growing airline networks in Asia.
(A) Number of nodes (countries belonging to the Asian air transport network), the number of airlines, and total passenger flow in the Asian air transport network between 1982–2012. Records are not available for the period 1983–1991, so dashed lines represented imputed missing values obtained by linear interpolation. (B) Passenger flux in Asia in 1982, 2000 and 2012. The size of each node corresponds to the degree centrality of the country in the airline network. Color coded lines represent the volume of air passenger flux. Node colors correspond to the countries indicated on the right-hand side of the figure. Black points indicate countries for which no virus sequence was included in the genetic analyses. China shares one of the busiest Asian flight routes with Japan, which is indicated by an asterisk.
Fig 3
Fig 3. Predictors of DENV-1–3 diffusion in Asia.
In the top panel bars show δ, an indicator variable that governs the probability of inclusion or exclusion of the predictor in the model. In the lower panel, points and error bars indicate the mean and the 95% Bayesian credible intervals, respectively, of the estimated conditional effect size of the GLM coefficients (β|δ = 1) on a log scale, for each predictor variable. β is the effective size of the predictor variable. GDP: Gross domestic product; LSBCI: linear shipping bilateral connectivity index; CPT: container port throughput.
Fig 4
Fig 4. Maximum clade credibility trees of E gene of dengue virus serotypes in Asia.
(A) Phylogeographic molecular clock phylogeny of DENV-1 (n = 327), (B) DENV-2 (n = 357), (C) DENV-3 (n = 202, after removal of sylvatic lineages). Branches are colored according to most probable geographic location, as inferred using a Bayesian discrete non-reversible phylogeographic approach.
Fig 5
Fig 5. Strongly supported pathways of lineage movement and histograms of the total number of location state transitions of DENV-1–3 in Asia for 1956 to 2015.
(A) Strongly supported state transitions, indicating migration of DENV-1–3 lineages among discrete locations. The size of points corresponds to the number of geographic connections. The colored lines represent statistical support for a given viral movement pathway. Only those viral lineage movements supported with a BF > 6 are shown. (B) Number of expected transitions into and out of each country per serotype. Error bars represent 95% BCIs.
Fig 6
Fig 6. Centrality measures of the air passenger network and number of state transitions.
(A) Scatterplot of centrality measures for the air travel network based on degree and betweenness. The “degree” centrality of a given country (node) refers to the number of airlines linking it in the airline network, and the “betweenness” centrality of a given country measures the extent to which a country lies on routes between other countries in airline network (see Methods). The size of each point corresponds to the number of expected Markov jump transitions (including both importations and exportations). (B) Net Markov jump counts, summed across all 3 DENV serotypes. For each country, we summarize the average net Markov jumps (jumps to—jumps from) and their 95% credible intervals. The estimates are ordered from the lowest to highest number of net jumps.

Similar articles

Cited by

References

    1. Bhatt S, Gething PW, Brady OJ, Messina JP, Farlow AW, et al. (2013) The global distribution and burden of dengue. Nature 496: 504–507. doi: 10.1038/nature12060 - DOI - PMC - PubMed
    1. Brady OJ, Gething PW, Bhatt S, Messina JP, Brownstein JS, et al. (2012) Refining the global spatial limits of dengue virus transmission by evidence-based consensus. PLoS Negl Trop Dis 6: e1760 doi: 10.1371/journal.pntd.0001760 - DOI - PMC - PubMed
    1. Luz PM, Vanni T, Medlock J, Paltiel AD, Galvani AP (2011) Dengue vector control strategies in an urban setting: an economic modelling assessment. Lancet 377: 1673–1680. doi: 10.1016/S0140-6736(11)60246-8 - DOI - PMC - PubMed
    1. Guzman MG, Harris E (2015) Dengue. Lancet 385: 453–465. doi: 10.1016/S0140-6736(14)60572-9 - DOI - PubMed
    1. Raghwani J, Rambaut A, Holmes EC, Hang VT, Hien TT, et al. (2011) Endemic dengue associated with the co-circulation of multiple viral lineages and localized density-dependent transmission. PLoS Pathog 7: e1002064 doi: 10.1371/journal.ppat.1002064 - DOI - PMC - PubMed

MeSH terms