. 2017 Aug 3;13(8):e1006911.
doi: 10.1371/journal.pgen.1006911. eCollection 2017 Aug.

Deconstructing isolation-by-distance: The genomic consequences of limited dispersal

Affiliations

Deconstructing isolation-by-distance: The genomic consequences of limited dispersal

Stepfanie M Aguillon et al. PLoS Genet. .

Abstract

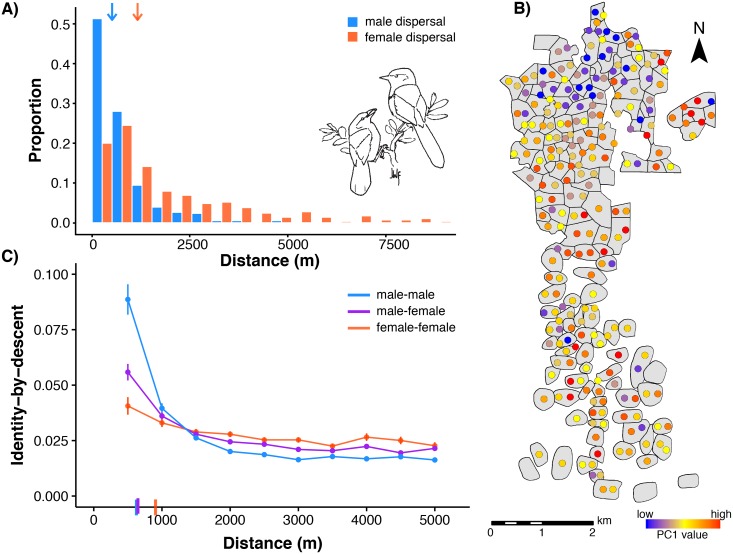
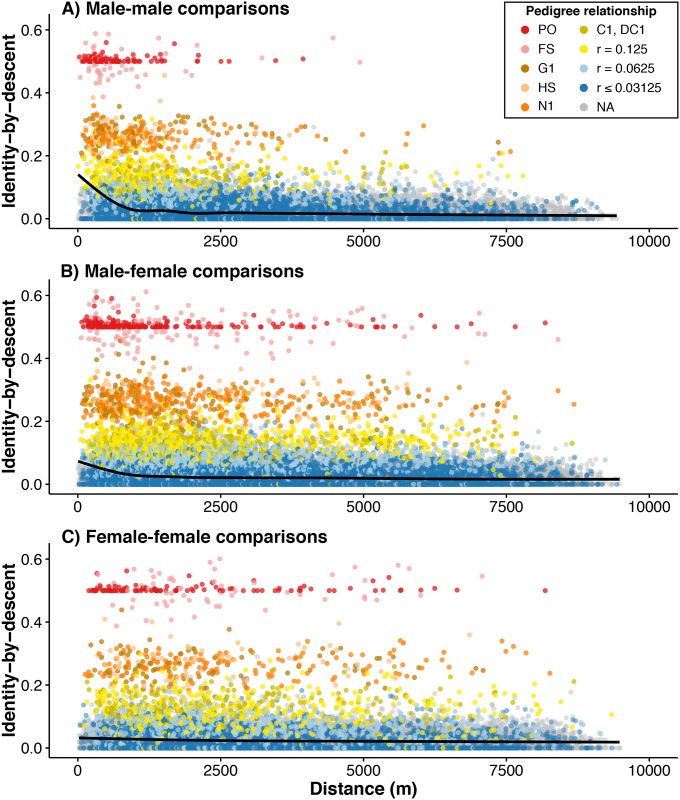
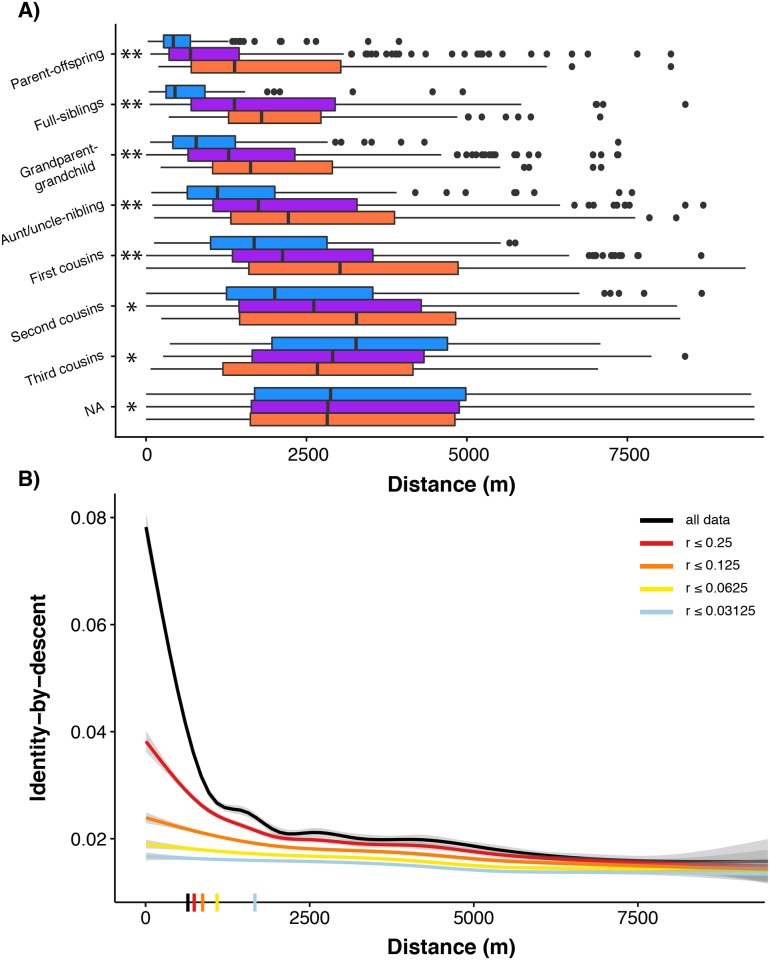
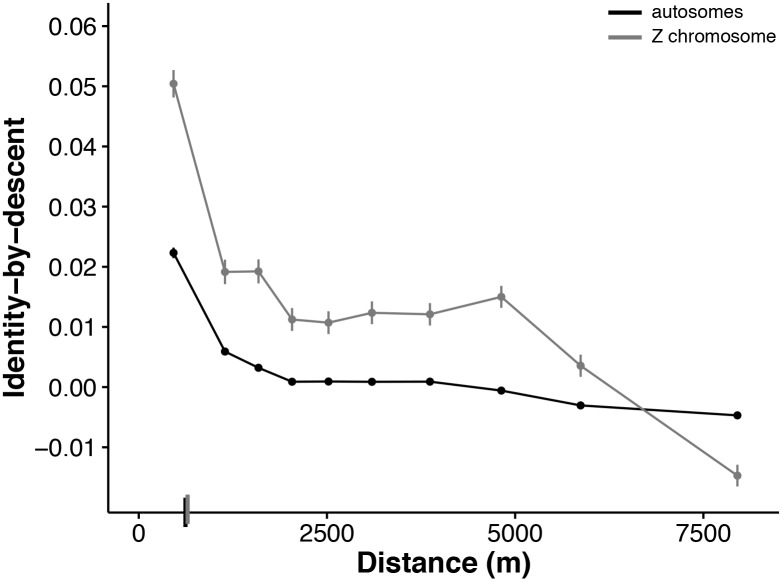
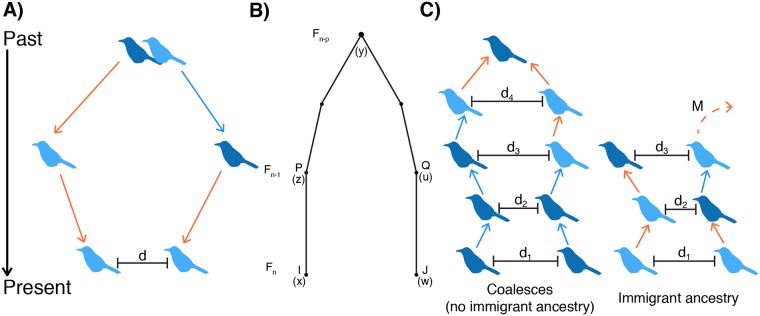
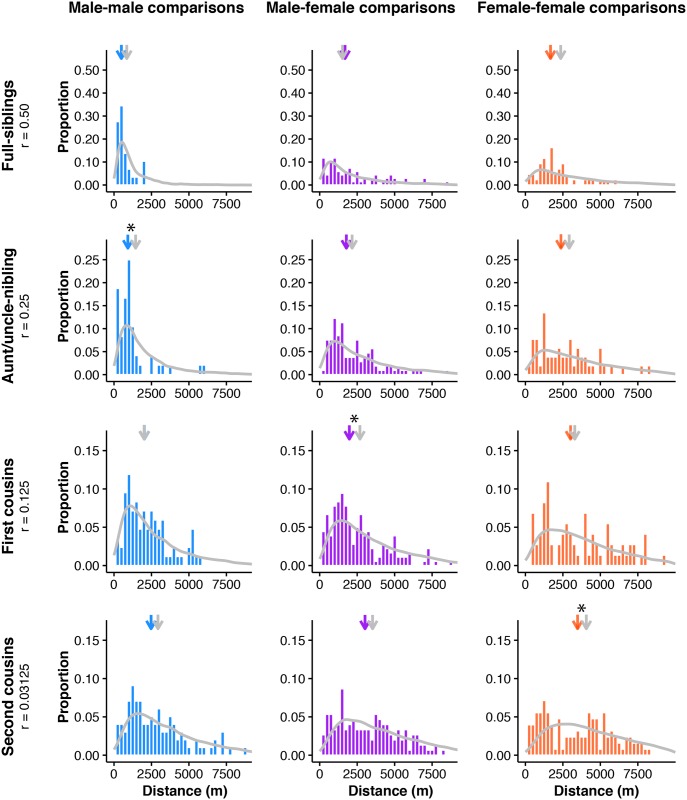
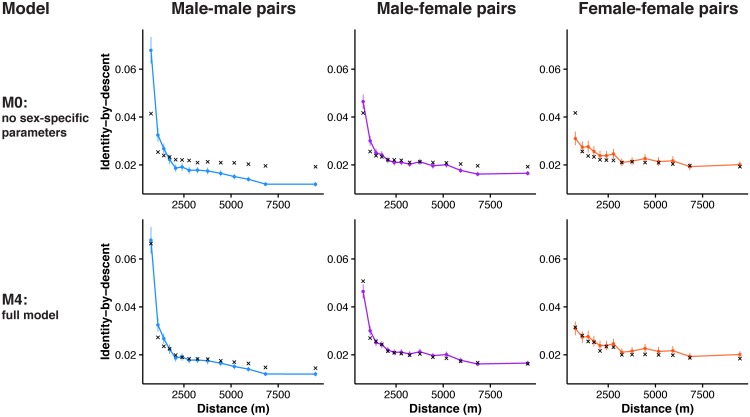
Geographically limited dispersal can shape genetic population structure and result in a correlation between genetic and geographic distance, commonly called isolation-by-distance. Despite the prevalence of isolation-by-distance in nature, to date few studies have empirically demonstrated the processes that generate this pattern, largely because few populations have direct measures of individual dispersal and pedigree information. Intensive, long-term demographic studies and exhaustive genomic surveys in the Florida Scrub-Jay (Aphelocoma coerulescens) provide an excellent opportunity to investigate the influence of dispersal on genetic structure. Here, we used a panel of genome-wide SNPs and extensive pedigree information to explore the role of limited dispersal in shaping patterns of isolation-by-distance in both sexes, and at an exceedingly fine spatial scale (within ~10 km). Isolation-by-distance patterns were stronger in male-male and male-female comparisons than in female-female comparisons, consistent with observed differences in dispersal propensity between the sexes. Using the pedigree, we demonstrated how various genealogical relationships contribute to fine-scale isolation-by-distance. Simulations using field-observed distributions of male and female natal dispersal distances showed good agreement with the distribution of geographic distances between breeding individuals of different pedigree relationship classes. Furthermore, we built coalescent simulations parameterized by the observed dispersal curve, population density, and immigration rate, and showed how incorporating these extensions to Malécot's theory of isolation-by-distance allows us to accurately reconstruct observed sex-specific isolation-by-distance patterns in autosomal and Z-linked SNPs. Therefore, patterns of fine-scale isolation-by-distance in the Florida Scrub-Jay can be well understood as a result of limited dispersal over contemporary timescales.


Conflict of interest statement

The authors have declared that no competing interests exist.

Figures

Fig 1
Fig 1. Dispersal curves and isolation-by-distance patterns in the Florida Scrub-Jay.
(A) Natal dispersal distances for Florida Scrub-Jays born and breeding within Archbold Biological Station (1990–2013, n = 672) are significantly shorter in males (blue bars; median ± SE = 488 ± 43 m) than in females (salmon bars; 1,149 ± 108 m; Wilcoxon rank sum test, p < 2.2 x 10⁻¹⁶). Median values are shown with arrows at top of plot. Florida Scrub-Jay drawing by JWF. (B) Map of breeding territories (gray polygons) for a representative year (2008) within Archbold with individual breeders colored by PC1 values shows isolation-by-distance from north to south. (C) Isolation-by-distance patterns in autosomal SNPs shown with standard error bars. The decline in identity-by-descent with geographic distance is stronger in male-male (blue) and male-female (purple) pairwise comparisons than in female-female comparisons (salmon). δ values, the distance where identity-by-descent drops halfway to the mean (see text for details), are shown as dashes on the x-axis.
Fig 2
Fig 2. Isolation-by-distance patterns in Florida Scrub-Jays can be deconstructed by pedigree relatedness.
Identity-by-descent in autosomal SNPs versus distance for all possible (A) male-male, (B) male-female, and (C) female-female comparisons is, in part, generated by highly related individuals remaining physically close together. Loess curves are shown in each panel. Isolation-by-distance patterns are significantly stronger in (A) male-male and (B) male-female comparisons than in (C) female-female comparisons. Points are colored by specific pedigree relationship or, for more distant relationships, grouped into a single coefficient of relationship (r) class. Gray points indicate no known pedigree relationship. Pedigree relationship abbreviations: PO = parent-offspring, FS = full-siblings, G1 = grandparent-grandchild, HS = half-siblings, N1 = aunt/uncle-nibling, C1 = first cousins, DC1 = double first cousins. (“Nibling” is a gender-neutral term for niece and nephew.)
Fig 3
Fig 3. Distances between Florida Scrub-Jay individuals of close pedigree relatedness explains, in part, the observed isolation-by-distance patterns.
(A) Distances between all possible male-male (blue), male-female (purple), and female-female (salmon) comparisons separated by pedigree relationship. Significant differences using the Kolmogorov-Smirnov Test are indicated with two asterisks when all three comparisons were significantly different (MM-FF, MM-MF, MF-FF) and a single asterisk when only MM-FF and MM-MF comparisons were significantly different. The distance between parent-offspring pairs is significantly shorter than the distance between full-siblings (Wilcoxon rank sum test, p = 5.20 x 10⁻⁹) and the distance between full-siblings is significantly shorter than the distance between pairs with r = 0.25 (Wilcoxon rank sum test, p = 0.01). (B) Loess curves of identity-by-descent in autosomal SNPs versus distance for all possible unique pairwise comparisons with separate lines showing sequential removal of pedigree relationship classes. The strength of isolation-by-distance decreases as highly related pairs are removed. δ values, the distance where identity-by-descent drops halfway to the mean (see text for details), are shown as dashes on the x-axis.
Fig 4
Fig 4. Isolation-by-distance in autosomal and Z-linked SNPs.
Unbiased identity-by-descent for autosomal (black) and Z-linked (gray) SNPs versus geographic distance for all possible unique pairwise comparisons showing higher mean identity-by-descent in Z-linked SNPs (0.014) than in autosomal SNPs (0.0027). Here we use untransformed estimates of identity-by-descent to avoid biases introduced by the different numbers of autosomal and Z-linked SNPs (see text for details). Identity-by-descent values are binned across 10 distance quantiles and shown as mean ± SE. δ values, the distance where identity-by-descent drops halfway to the mean (see text for details), are shown as dashes on the x-axis.
Fig 5
Fig 5. Overview of dispersal and coalescent simulations of isolation-by-distance.
(A) An example schematic of a dispersal simulation for two female first cousins. Our simulations were over a two-dimensional space, but here we show dispersal on a one-dimensional line for visualization purposes. For the dispersal simulations, we start with the most recent common ancestor for a pair of individuals of known pedigree relationship and simulate dispersal events forward in time until the present. In this case, we start at the grandparental nest, simulate dispersal distances (and angles) of the parents, and then dispersal of the two cousins. Light blue birds are females and dark blue are males. Arrows indicate male (blue) and female (salmon) dispersal events drawn from the dispersal curves. In most simulations, sexes of all ancestors are randomly determined. (B) The gametic kinship chain from Malécot’s theory of isolation-by-distance. A locus from individual I born at location x and a locus from individual J born at location w in generation Fn are identical-by-descent if both are descended from the same locus in their common ancestor in generation Fn-p. Under Malécot’s model, genetic relatedness of individuals should decrease as the distance between them increases. Redrawn from [9]. (C) Illustration of two possible outcomes in the coalescent simulations. In these simulations, we start with a pair of individuals of specified sex separated by distance d1 and trace their ancestral lineages backwards in time until we either reach a common ancestor or one of the ancestors was an immigrant. In each generation, the probability a given pair coalesces is sampled directly from the pedigree. M is the probability a parental individual is an immigrant. Using empirical estimates of identity-by-descent between closely related pairs and immigrants, we generated expected identity-by-descent values for each pair.
Fig 6
Fig 6. Dispersal simulations can reconstruct the observed distribution of geographic distances between related pairs.
Simulated (gray line) and observed (colored histograms) dispersal values for full-sibling, aunt/uncle-nibling, first cousin, and second cousin comparisons. Male-male comparisons are shown in blue, male-female comparisons in purple, and female-female comparisons in salmon. Median values for the simulated (gray) and observed (colored) distributions are indicated by arrows above each plot. Simulated distributions that were significantly different from the observed distribution using the Kolmogorov-Smirnov Test are marked with asterisks above the median arrows. See S7 Table for full statistical results.
Fig 7
Fig 7. Coalescent simulations can reconstruct isolation-by-distance patterns.
Simulated (black crosses) and observed (colored circles and line) autosomal isolation-by-distance patterns for male-male (blue), male-female (purple), and female-female comparisons (salmon). We ran five different simulations using the observed pedigree, dispersal curves, and immigration rate. Results are shown for two models: the simplest model with no sex-specific parameters (M0) on top and our final model with sex-specific parameters and isolation-by-distance in immigrants (M4) on bottom. By increasing the biological realism of our models, we can recover the observed pattern of isolation-by-distance. The coefficient of determination for the final model is 0.98 for male-male comparisons, 0.96 for male-female comparisons, and 0.78 for female-female comparisons. See Table 1 and S10 Fig for full results.

Similar articles

Cited by

References

    1. Clobert J, Danchin E, Dhont AA, Nichols JD. Dispersal. Oxford, UK: Oxford University Press; 2001.
    1. Coulon A, Fitzpatrick JW, Bowman R, Lovette IJ. Mind the gap: genetic distance increases with habitat gap size in Florida scrub jays. Biol Lett. 2012;8(4):582–5. doi: 10.1098/rsbl.2011.1244 . - DOI - PMC - PubMed
    1. Coulon A, Fitzpatrick JW, Bowman R, Lovette IJ. Effects of habitat fragmentation on effective dispersal of Florida scrub-jays. Conserv Biol. 2010;24(4):1080–8. doi: 10.1111/j.1523-1739.2009.01438.x . - DOI - PubMed
    1. Duckworth RA, Badyaev AV. Coupling of dispersal and aggression facilitates the rapid range expansion of a passerine bird. Proc Natl Acad Sci USA. 2007;104(38):15017–22. doi: 10.1073/pnas.0706174104 . - DOI - PMC - PubMed
    1. Wright S. Isolation by distance under diverse systems of mating. Genetics. 1946;31:39–59. - PMC - PubMed