

Quantitative and qualitative estimation of atherosclerotic plaque burden in vivo at 7T MRI using Gadospin F in comparison to en face preparation evaluated in ApoE KO mice
- PMID: 28771481
- PMCID: PMC5542445
- DOI: 10.1371/journal.pone.0180407
Quantitative and qualitative estimation of atherosclerotic plaque burden in vivo at 7T MRI using Gadospin F in comparison to en face preparation evaluated in ApoE KO mice
Abstract
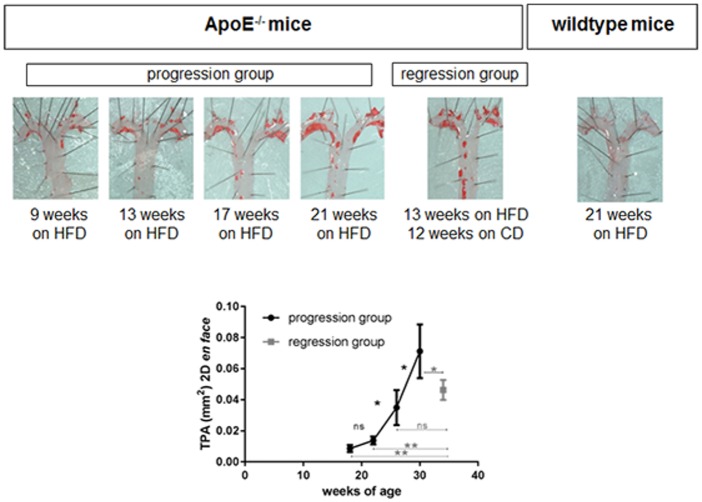
Background: The aim of the study was to quantify atherosclerotic plaque burden by volumetric assessment and T1 relaxivity measurement at 7T MRI using Gadospin F (GDF) in comparison to en face based measurements.
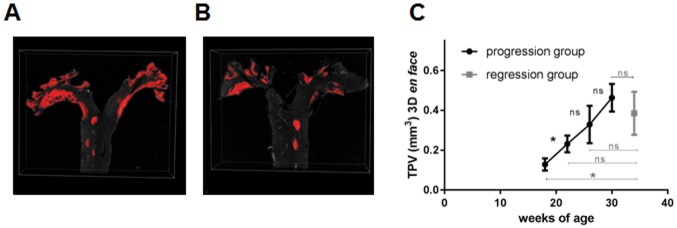
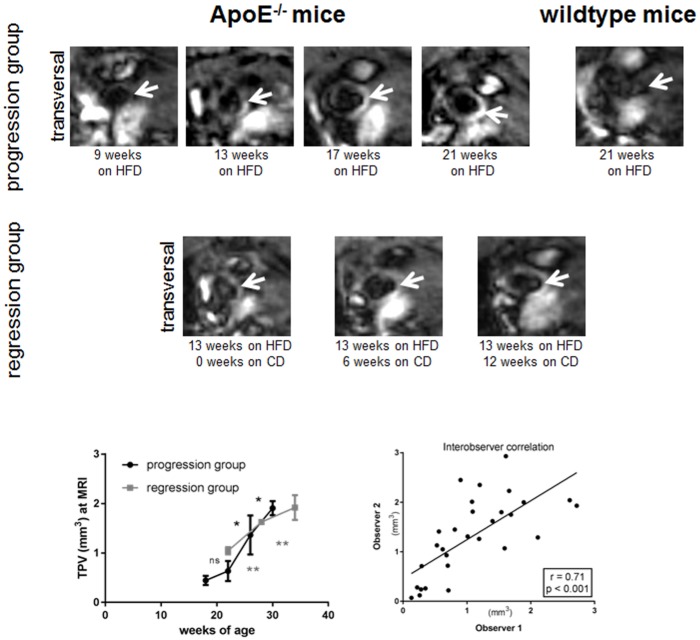
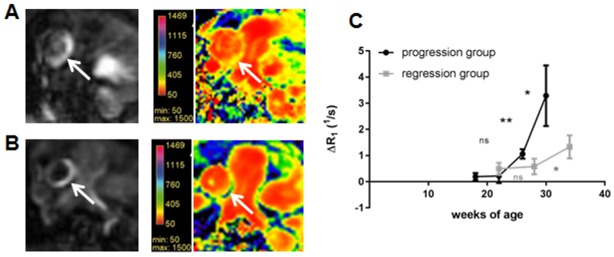
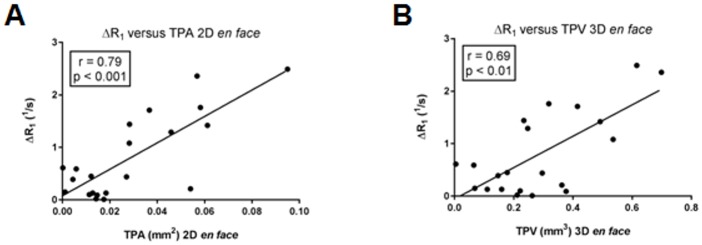
Methods and results: 9-weeks old ApoE-/- (n = 5 for each group) and wildtype mice (n = 5) were set on high fat diet (HFD). Progression group received MRI at 9, 13, 17 and 21 weeks after HFD initiation. Regression group was reswitched to chow diet (CD) after 13 weeks HFD and monitored with MRI for 12 weeks. MRI was performed before and two hours after iv injection of GDF (100 μmol/kg) at 7T (Clinscan, Bruker) acquiring a 3D inversion recovery gradient echo sequence and T1 Mapping using Saturation Recovery sequences. Subsequently, aortas were prepared for en face analysis using confocal microscopy. Total plaque volume (TPV) and T1 relaxivity were estimated using ImageJ (V. 1.44p, NIH, USA). 2D and 3D en face analysis showed a strong and exponential increase of plaque burden over time, while plaque burden in regression group was less pronounced. Correspondent in vivo MRI measurements revealed a more linear increase of TPV and T1 relaxivity for regression group. A significant correlation was observed between 2D and 3D en face analysis (r = 0.79; p<0.001) as well as between 2D / 3D en face analysis and MRI (r = 0.79; p<0.001; r = 0.85; p<0.001) and delta R1 (r = 0.79; p<0.001; r = 0.69; p<0.01).
Conclusion: GDF-enhanced in vivo MRI is a powerful non-invasive imaging technique in mice allowing for reliable estimation of atherosclerotic plaque burden, monitoring of disease progression and regression in preclinical studies.
Conflict of interest statement
Figures


Similar articles
-
Gadospin F-enhanced magnetic resonance imaging for diagnosis and monitoring of atherosclerosis: validation with transmission electron microscopy and x-ray fluorescence imaging in the apolipoprotein e-deficient mouse.Mol Imaging. 2014;13. doi: 10.2310/7290.2014.00039. Mol Imaging. 2014. PMID: 25342533
-
Quantification of plaque lipids in the aortic root of ApoE-deficient mice by 3D DIXON magnetic resonance imaging in an ex vivo model.Eur Radiol. 2015 Mar;25(3):736-44. doi: 10.1007/s00330-014-3456-7. Epub 2014 Oct 31. Eur Radiol. 2015. PMID: 25358593
-
Absence of the Vitamin D Receptor Inhibits Atherosclerotic Plaque Calcification in Female Hypercholesterolemic Mice.J Cell Biochem. 2017 May;118(5):1050-1064. doi: 10.1002/jcb.25679. Epub 2017 Jan 5. J Cell Biochem. 2017. PMID: 27567005
-
[Value of in vivo monitoring of abdominal aortic atherosclerosis by high field magnetic resonance imaging in apoE-/- mice fed a high fat diet or infused with angiotensin II].Zhonghua Xin Xue Guan Bing Za Zhi. 2010 Sep;38(9):823-8. Zhonghua Xin Xue Guan Bing Za Zhi. 2010. PMID: 21092653 Chinese.
-
[Feasibility of targeted magnetic resonance imaging on visualizing tenascin-C expression in atherosclerosis plaque in high-fat diet fed ApoE(-/-) mice].Zhonghua Xin Xue Guan Bing Za Zhi. 2016 Apr 24;44(4):342-7. doi: 10.3760/cma.j.issn.0253-3758.2016.04.013. Zhonghua Xin Xue Guan Bing Za Zhi. 2016. PMID: 27112614 Chinese.
Cited by
-
Can atherosclerosis be cured?Curr Opin Lipidol. 2019 Dec;30(6):477-484. doi: 10.1097/MOL.0000000000000644. Curr Opin Lipidol. 2019. PMID: 31592794 Free PMC article. Review.
-
Evaluation of Plaque Characteristics and Inflammation Using Magnetic Resonance Imaging.Biomedicines. 2021 Feb 12;9(2):185. doi: 10.3390/biomedicines9020185. Biomedicines. 2021. PMID: 33673124 Free PMC article. Review.
-
Three-Dimensional Imaging Provides Detailed Atherosclerotic Plaque Morphology and Reveals Angiogenesis After Carotid Artery Ligation.Circ Res. 2020 Feb 28;126(5):619-632. doi: 10.1161/CIRCRESAHA.119.315804. Epub 2020 Jan 9. Circ Res. 2020. PMID: 31914850 Free PMC article.
-
High Resolution Episcopic Microscopy for Qualitative and Quantitative Data in Phenotyping Altered Embryos and Adult Mice Using the New "Histo3D" System.Biomedicines. 2021 Jul 1;9(7):767. doi: 10.3390/biomedicines9070767. Biomedicines. 2021. PMID: 34356832 Free PMC article.
-
High-field magnetic resonance microscopy of aortic plaques in a mouse model of atherosclerosis.MAGMA. 2023 Dec;36(6):887-896. doi: 10.1007/s10334-023-01102-1. Epub 2023 Jul 8. MAGMA. 2023. PMID: 37421501 Free PMC article.
References
-
- Hackam DG, Anand SS (2003) Emerging risk factors for atherosclerotic vascular disease: a critical review of the evidence. JAMA 290: 932–940. doi: 10.1001/jama.290.7.932 - DOI - PubMed
-
- Martinez HG, Prajapati SI, Estrada CA, Jimenez F, Quinones MP, et al. (2009) Images in cardiovascular medicine: Microscopic computed tomography-based virtual histology for visualization and morphometry of atherosclerosis in diabetic apolipoprotein e mutant mice. Circulation 120: 821–822. doi: 10.1161/CIRCULATIONAHA.108.829531 - DOI - PMC - PubMed
-
- Choudhury RP, Fuster V, Fayad ZA (2004) Molecular, cellular and functional imaging of atherothrombosis. Nat Rev Drug Discov 3: 913–925. doi: 10.1038/nrd1548 - DOI - PubMed
-
- Sanz J, Fayad ZA (2008) Imaging of atherosclerotic cardiovascular disease. Nature 451: 953–957. doi: 10.1038/nature06803 - DOI - PubMed
-
- Paigen B, Morrow A, Holmes PA, Mitchell D, Williams RA (1987) Quantitative assessment of atherosclerotic lesions in mice. Atherosclerosis 68: 231–240. - PubMed
Publication types
MeSH terms
Substances
LinkOut - more resources
Full Text Sources
Other Literature Sources
Medical
Molecular Biology Databases
Research Materials
Miscellaneous
