

Cardiorespiratory dynamics measured from continuous ECG monitoring improves detection of deterioration in acute care patients: A retrospective cohort study
- PMID: 28771487
- PMCID: PMC5542430
- DOI: 10.1371/journal.pone.0181448
Cardiorespiratory dynamics measured from continuous ECG monitoring improves detection of deterioration in acute care patients: A retrospective cohort study
Abstract
Background: Charted vital signs and laboratory results represent intermittent samples of a patient's dynamic physiologic state and have been used to calculate early warning scores to identify patients at risk of clinical deterioration. We hypothesized that the addition of cardiorespiratory dynamics measured from continuous electrocardiography (ECG) monitoring to intermittently sampled data improves the predictive validity of models trained to detect clinical deterioration prior to intensive care unit (ICU) transfer or unanticipated death.
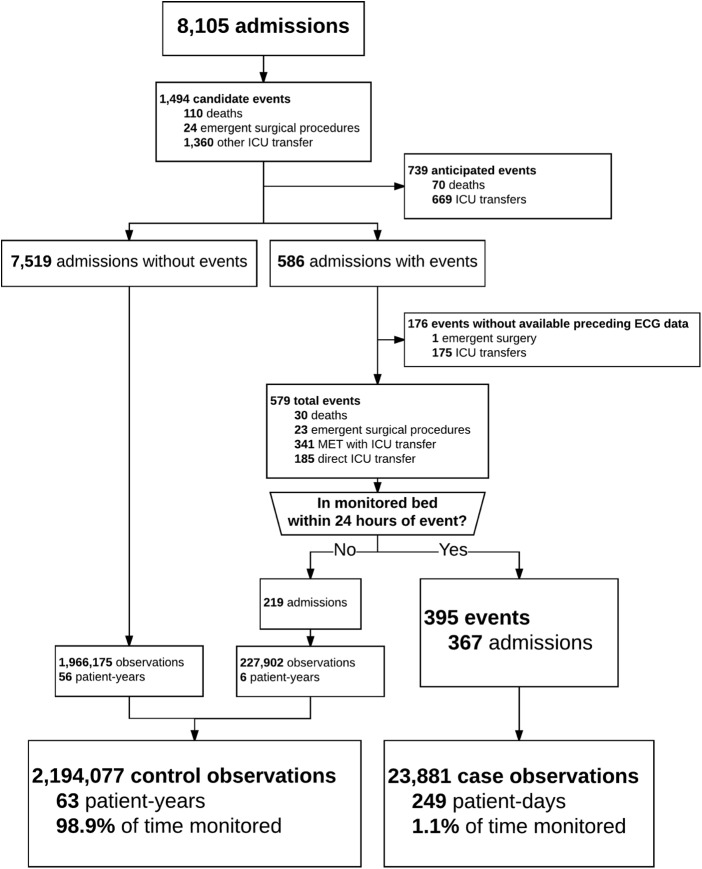
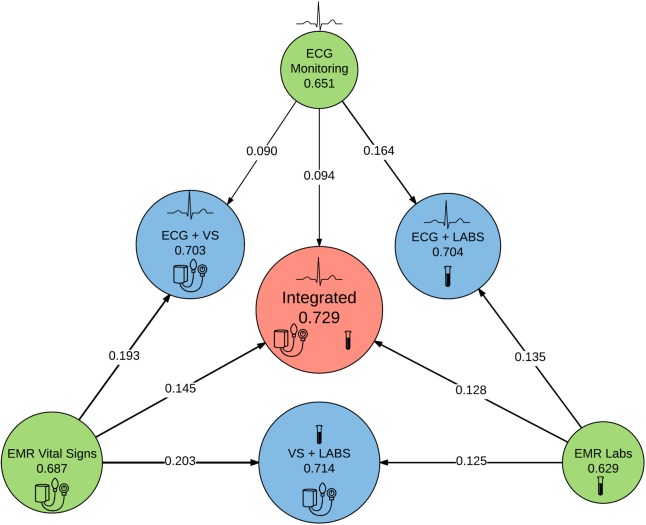
Methods and findings: We analyzed 63 patient-years of ECG data from 8,105 acute care patient admissions at a tertiary care academic medical center. We developed models to predict deterioration resulting in ICU transfer or unanticipated death within the next 24 hours using either vital signs, laboratory results, or cardiorespiratory dynamics from continuous ECG monitoring and also evaluated models using all available data sources. We calculated the predictive validity (C-statistic), the net reclassification improvement, and the probability of achieving the difference in likelihood ratio χ2 for the additional degrees of freedom. The primary outcome occurred 755 times in 586 admissions (7%). We analyzed 395 clinical deteriorations with continuous ECG data in the 24 hours prior to an event. Using only continuous ECG measures resulted in a C-statistic of 0.65, similar to models using only laboratory results and vital signs (0.63 and 0.69 respectively). Addition of continuous ECG measures to models using conventional measurements improved the C-statistic by 0.01 and 0.07; a model integrating all data sources had a C-statistic of 0.73 with categorical net reclassification improvement of 0.09 for a change of 1 decile in risk. The difference in likelihood ratio χ2 between integrated models with and without cardiorespiratory dynamics was 2158 (p value: <0.001).
Conclusions: Cardiorespiratory dynamics from continuous ECG monitoring detect clinical deterioration in acute care patients and improve performance of conventional models that use only laboratory results and vital signs.
Conflict of interest statement
Figures
Similar articles
-
Towards development of alert thresholds for clinical deterioration using continuous predictive analytics monitoring.J Clin Monit Comput. 2020 Aug;34(4):797-804. doi: 10.1007/s10877-019-00361-5. Epub 2019 Jul 20. J Clin Monit Comput. 2020. PMID: 31327101
-
Predicting in-hospital mortality and unanticipated admissions to the intensive care unit using routinely collected blood tests and vital signs: Development and validation of a multivariable model.Resuscitation. 2018 Dec;133:75-81. doi: 10.1016/j.resuscitation.2018.09.021. Epub 2018 Sep 22. Resuscitation. 2018. PMID: 30253229 Free PMC article.
-
Feasibility study of the use of a wearable vital sign patch in an intensive care unit setting.J Clin Monit Comput. 2025 Feb;39(1):245-256. doi: 10.1007/s10877-024-01207-5. Epub 2024 Aug 19. J Clin Monit Comput. 2025. PMID: 39158782
-
The value of vital sign trends in predicting and monitoring clinical deterioration: A systematic review.PLoS One. 2019 Jan 15;14(1):e0210875. doi: 10.1371/journal.pone.0210875. eCollection 2019. PLoS One. 2019. PMID: 30645637 Free PMC article.
-
Continuous ECG monitoring should be the heart of bedside AI-based predictive analytics monitoring for early detection of clinical deterioration.J Electrocardiol. 2023 Jan-Feb;76:35-38. doi: 10.1016/j.jelectrocard.2022.10.011. Epub 2022 Nov 2. J Electrocardiol. 2023. PMID: 36434848 Free PMC article. Review.
Cited by
-
Principles for Real-World Implementation of Bedside Predictive Analytics Monitoring.Appl Clin Inform. 2021 Aug;12(4):888-896. doi: 10.1055/s-0041-1735183. Epub 2021 Sep 22. Appl Clin Inform. 2021. PMID: 34553360 Free PMC article.
-
External validation of a novel signature of illness in continuous cardiorespiratory monitoring to detect early respiratory deterioration of ICU patients.Physiol Meas. 2021 Sep 27;42(9):10.1088/1361-6579/ac2264. doi: 10.1088/1361-6579/ac2264. Physiol Meas. 2021. PMID: 34580242 Free PMC article.
-
Individual illness dynamics: An analysis of children with sepsis admitted to the pediatric intensive care unit.PLOS Digit Health. 2022 Mar 17;1(3):e0000019. doi: 10.1371/journal.pdig.0000019. eCollection 2022 Mar. PLOS Digit Health. 2022. PMID: 36812513 Free PMC article.
-
Dynamic data in the ED predict requirement for ICU transfer following acute care admission.J Clin Monit Comput. 2021 May;35(3):515-523. doi: 10.1007/s10877-020-00500-3. Epub 2020 Mar 19. J Clin Monit Comput. 2021. PMID: 32193694 Free PMC article.
-
Predictive Monitoring-Impact in Acute Care Cardiology Trial (PM-IMPACCT): Protocol for a Randomized Controlled Trial.JMIR Res Protoc. 2021 Jul 2;10(7):e29631. doi: 10.2196/29631. JMIR Res Protoc. 2021. PMID: 34043525 Free PMC article.
References
-
- Bailey TC, Chen Y, Mao Y, Lu C, Hackmann G, Micek ST, et al. A trial of a real-time alert for clinical deterioration in patients hospitalized on general medical wards. J Hosp Med. 2013;8: 236–242. doi: 10.1002/jhm.2009 - DOI - PubMed
-
- Churpek MM, Yuen TC, Park SY, Gibbons R, Edelson DP. Using electronic health record data to develop and validate a prediction model for adverse outcomes in the wards*. Crit Care Med. 2014;42: 841–848. doi: 10.1097/CCM.0000000000000038 - DOI - PMC - PubMed
-
- Young MP, Gooder VJ, McBride K, James B, Fisher ES. Inpatient transfers to the intensive care unit: delays are associated with increased mortality and morbidity. J Gen Intern Med. 2003;18: 77–83. doi: 10.1046/j.1525-1497.2003.20441.x - DOI - PMC - PubMed
-
- Cardoso LT, Grion CM, Matsuo T, Anami EH, Kauss IA, Seko L, et al. Impact of delayed admission to intensive care units on mortality of critically ill patients: a cohort study. Crit Care. 2011;15: R28 doi: 10.1186/cc9975 - DOI - PMC - PubMed
-
- Gardner-Thorpe J, Love N, Wrightson J, Walsh S, Keeling N. The value of Modified Early Warning Score (MEWS) in surgical in-patients: a prospective observational study. Ann R Coll Surg Engl. 2006;88: 571–575. doi: 10.1308/003588406X130615 - DOI - PMC - PubMed
MeSH terms
Grants and funding
LinkOut - more resources
Full Text Sources
Other Literature Sources
