

Follow that fish: Uncovering the hidden blue economy in coral reef fisheries
- PMID: 28771508
- PMCID: PMC5542444
- DOI: 10.1371/journal.pone.0182104
Follow that fish: Uncovering the hidden blue economy in coral reef fisheries
Abstract
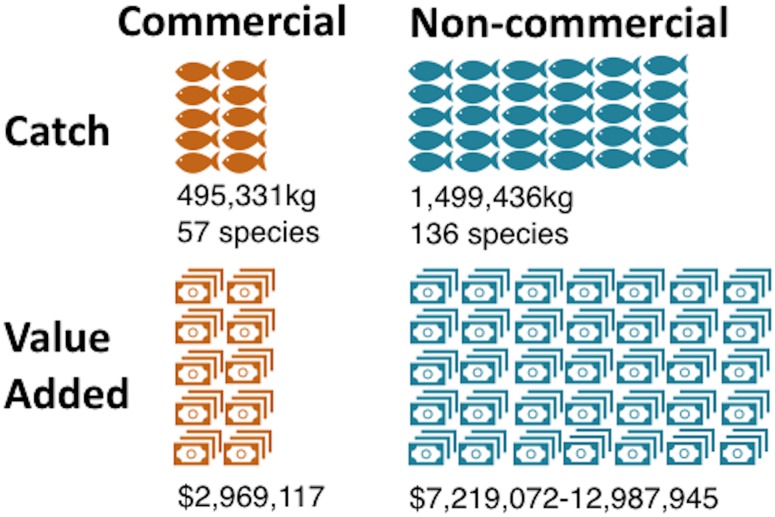
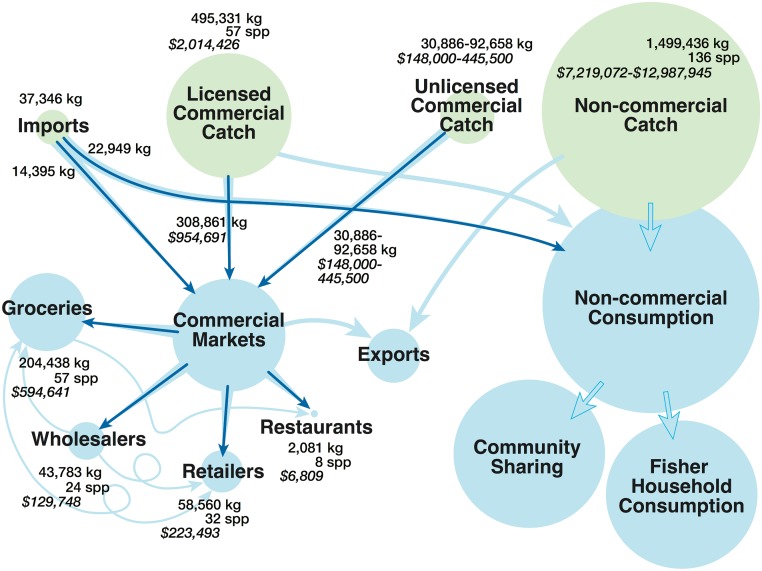
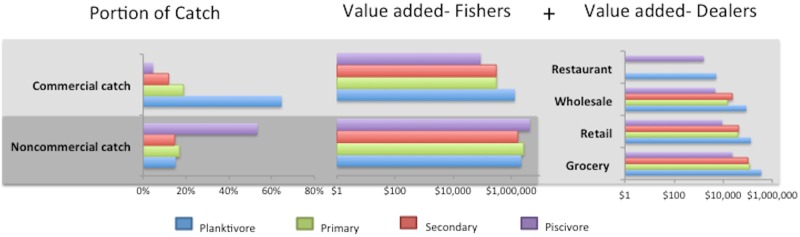
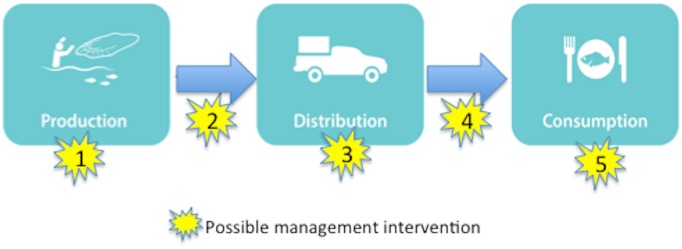
Despite their importance for human well-being, nearshore fisheries are often data poor, undervalued, and underappreciated in policy and development programs. We assess the value chain for nearshore Hawaiian coral reef fisheries, mapping post-catch distribution and disposition, and quantifying associated monetary, food security, and cultural values. We estimate that the total annual value of the nearshore fishery in Hawai'i is $10.3-$16.4 million, composed of non-commercial ($7.2-$12.9 million) and commercial ($2.97 million licensed + $148,500-$445,500 unlicensed) catch. Hawaii's nearshore fisheries provide >7 million meals annually, with most (>5 million) from the non-commercial sector. Over a third (36%) of meals were planktivores, 26% piscivores, 21% primary consumers, and 18% secondary consumers. Only 62% of licensed commercial catch is accounted for in purchase reports, leaving 38% of landings unreported in sales. Value chains are complex, with major buyers for the commercial fishery including grocery stores (66%), retailers (19%), wholesalers (14%), and restaurants (<1%), who also trade and sell amongst themselves. The bulk of total nearshore catch (72-74%) follows a short value chain, with non-commercial fishers keeping catch for household consumption or community sharing. A small amount (~37,000kg) of reef fish-the equivalent of 1.8% of local catch-is imported annually into Hawai'i, 23,000kg of which arrives as passenger luggage on commercial flights from Micronesia. Evidence of exports to the US mainland exists, but is unquantifiable given existing data. Hawaiian nearshore fisheries support fundamental cultural values including subsistence, activity, traditional knowledge, and social cohesion. These small-scale coral reef fisheries provide large-scale benefits to the economy, food security, and cultural practices of Hawai'i, underscoring the need for sustainable management. This research highlights the value of information on the value chain for small-scale production systems, making the hidden economy of these fisheries visible and illuminating a range of conservation interventions applicable to Hawai'i and beyond.
Conflict of interest statement
Figures
References
-
- Berkes F. Managing small-scale fisheries: alternative directions and methods [Internet]. International Development Research Centre; 2001. https://www.idrc.ca/en/book/managing-small-scale-fisheries-alternative-d...
-
- Béné C, Hersoug B, Allison EH. Not by rent alone: analysing the pro-poor functions of small-scale fisheries in developing countries. Dev Policy Rev. 2010;28: 325–358.
-
- Cisneros-Montemayor AM, Pauly D, Weatherdon LV, Ota Y. A Global Estimate of Seafood Consumption by Coastal Indigenous Peoples. PloS One. 2016;11: e0166681 doi: 10.1371/journal.pone.0166681 - DOI - PMC - PubMed
-
- Jacquet J, Pauly D. Funding priorities: big barriers to small-scale fisheries. Conserv Biol. 2008;22: 832–835. doi: 10.1111/j.1523-1739.2008.00978.x - DOI - PubMed
-
- Chuenpagdee R, Liguori L, Palomares ML, Pauly D. Bottom-up, global estimates of small-scale marine fisheries catches. 2012; https://open.library.ubc.ca/collections/ubccommunityandpartnerspublicati...
MeSH terms
LinkOut - more resources
Full Text Sources
Other Literature Sources
Miscellaneous
