

ACE phenotyping in human heart
- PMID: 28771512
- PMCID: PMC5542439
- DOI: 10.1371/journal.pone.0181976
ACE phenotyping in human heart
Abstract
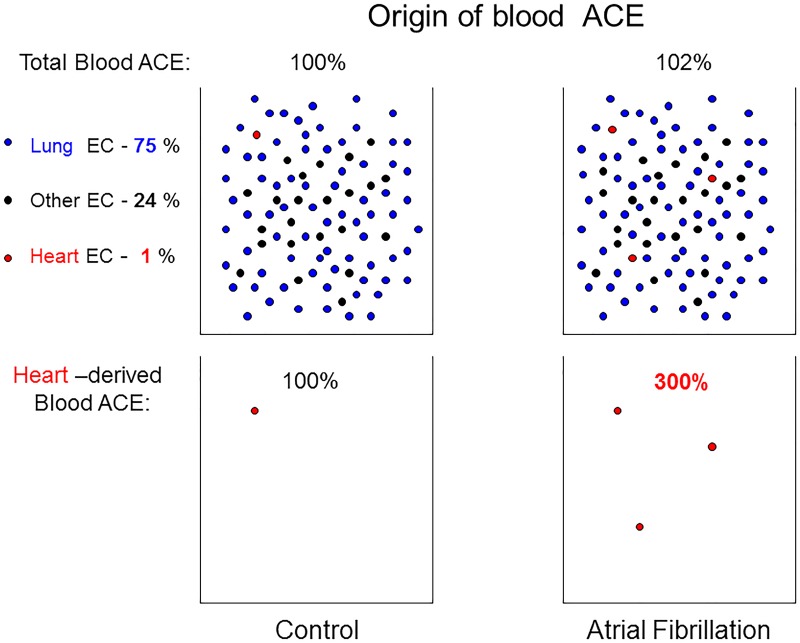
Aims: Angiotensin-converting enzyme (ACE), which metabolizes many peptides and plays a key role in blood pressure regulation and vascular remodeling, is expressed as a type-1 membrane glycoprotein on the surface of different cells, including endothelial cells of the heart. We hypothesized that the local conformation and, therefore, the properties of heart ACE could differ from lung ACE due to different microenvironment in these organs.
Methods and results: We performed ACE phenotyping (ACE levels, conformation and kinetic characteristics) in the human heart and compared it with that in the lung. ACE activity in heart tissues was 10-15 lower than that in lung. Various ACE effectors, LMW endogenous ACE inhibitors and HMW ACE-binding partners, were shown to be present in both heart and lung tissues. "Conformational fingerprint" of heart ACE (i.e., the pattern of 17 mAbs binding to different epitopes on the ACE surface) significantly differed from that of lung ACE, which reflects differences in the local conformations of these ACEs, likely controlled by different ACE glycosylation in these organs. Substrate specificity and pH-optima of the heart and lung ACEs also differed. Moreover, even within heart the apparent ACE activities, the local ACE conformations, and the content of ACE inhibitors differ in atria and ventricles.
Conclusions: Significant differences in the local conformations and kinetic properties of heart and lung ACEs demonstrate tissue specificity of ACE and provide a structural base for the development of mAbs able to distinguish heart and lung ACEs as a potential blood test for predicting atrial fibrillation risk.
Conflict of interest statement
Figures


Similar articles
-
Conformational fingerprint of blood and tissue ACEs: Personalized approach.PLoS One. 2018 Dec 27;13(12):e0209861. doi: 10.1371/journal.pone.0209861. eCollection 2018. PLoS One. 2018. PMID: 30589901 Free PMC article.
-
Tissue Specificity of Human Angiotensin I-Converting Enzyme.PLoS One. 2015 Nov 23;10(11):e0143455. doi: 10.1371/journal.pone.0143455. eCollection 2015. PLoS One. 2015. PMID: 26600189 Free PMC article.
-
Tissue ACE phenotyping in lung cancer.PLoS One. 2019 Dec 26;14(12):e0226553. doi: 10.1371/journal.pone.0226553. eCollection 2019. PLoS One. 2019. PMID: 31877149 Free PMC article.
-
[Conformational Fingerprinting Using Monoclonal Antibodies <br />(on the Example of Angiotensin I-Converting Enzyme-ACE)].Mol Biol (Mosk). 2017 Nov-Dec;51(6):1046-1061. doi: 10.7868/S0026898417060155. Mol Biol (Mosk). 2017. PMID: 29271967 Review. Russian.
-
Comparative studies of tissue inhibition by angiotensin converting enzyme inhibitors.J Hypertens Suppl. 1989 Sep;7(5):S11-6. J Hypertens Suppl. 1989. PMID: 2553899 Review.
Cited by
-
Conformational fingerprint of blood and tissue ACEs: Personalized approach.PLoS One. 2018 Dec 27;13(12):e0209861. doi: 10.1371/journal.pone.0209861. eCollection 2018. PLoS One. 2018. PMID: 30589901 Free PMC article.
-
ACE Phenotyping in Human Blood and Tissues: Revelation of ACE Outliers and Sex Differences in ACE Sialylation.Biomedicines. 2024 Apr 23;12(5):940. doi: 10.3390/biomedicines12050940. Biomedicines. 2024. PMID: 38790902 Free PMC article.
-
The association of ACE I/D polymorphism with the severity of COVID-19 in Iranian patients: A case-control study.Hum Gene (Amst). 2022 Dec;34:201099. doi: 10.1016/j.humgen.2022.201099. Epub 2022 Aug 10. Hum Gene (Amst). 2022. PMID: 37521445 Free PMC article.
-
Tissue ACE phenotyping in prostate cancer.Oncotarget. 2019 Oct 29;10(59):6349-6361. doi: 10.18632/oncotarget.27276. eCollection 2019 Oct 29. Oncotarget. 2019. PMID: 31695843 Free PMC article.
-
Human Angiotensin I-Converting Enzyme Produced by Different Cells: Classification of the SERS Spectra with Linear Discriminant Analysis.Biomedicines. 2022 Jun 12;10(6):1389. doi: 10.3390/biomedicines10061389. Biomedicines. 2022. PMID: 35740411 Free PMC article.
References
-
- Go AS, Hylek EM, Phillips KA, Chang Y, Henault LE, Selby JV, et al. Prevalence of diagnosed atrial fibrillation in adults: national implications for rhythm management and stroke prevention: the Anticoagulation and Risk Factors in Atrial Fibrillation (ATRIA) study. JAMA. 2001;285: 2370–2375. - PubMed
-
- Goette A, Staack T, Rӧcken C, Arndt M, Geller JC, Huth C, et al. Increased expression of extracellular signal-regulated kinase and angiotensin-converting enzyme in human atria during atrial fibrillation. J Am Coll Cardiol. 2000;35: 1669–1677. - PubMed
-
- Ehrlich JR, Hohnloser SH, Nattel S. Role of angiotensin system and effects of its inhibition in atrial fibrillation: clinical and experimental evidence. Eur Heart J. 2006;27: 512–518. doi: 10.1093/eurheartj/ehi668 - DOI - PubMed
-
- Iravanian S, Dudley SC Jr. The renin-angiotensin-aldosterone system (RAAS) and cardiac arrhythmias. Heart Rhythm. 2008;5: S12–S17. doi: 10.1016/j.hrthm.2008.02.025 - DOI - PMC - PubMed
-
- Kasi VS, Xiao HD, Shang LL, Iravanian S, Langberg J, Witham EA, et al. Cardiac restricted angiotensin converting enzyme overexpression causes conduction defects and connexin dysregulation. Am J Physiol Heart Circ Physiol. 2007;293: H182–H192. doi: 10.1152/ajpheart.00684.2006 - DOI - PMC - PubMed
MeSH terms
Substances
LinkOut - more resources
Full Text Sources
Other Literature Sources
Miscellaneous
