. 2017 Aug 3;12(8):e0182514.
doi: 10.1371/journal.pone.0182514. eCollection 2017.

Laminar differences in response to simple and spectro-temporally complex sounds in the primary auditory cortex of ketamine-anesthetized gerbils

Affiliations

Laminar differences in response to simple and spectro-temporally complex sounds in the primary auditory cortex of ketamine-anesthetized gerbils

Markus K Schaefer et al. PLoS One. .

Abstract

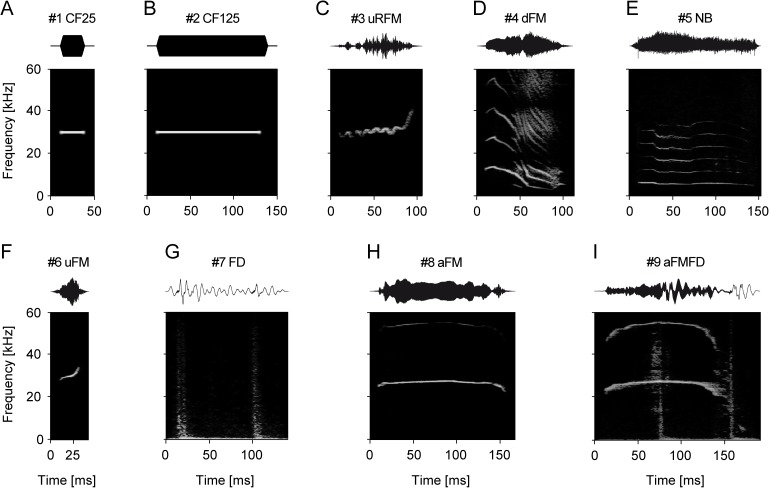
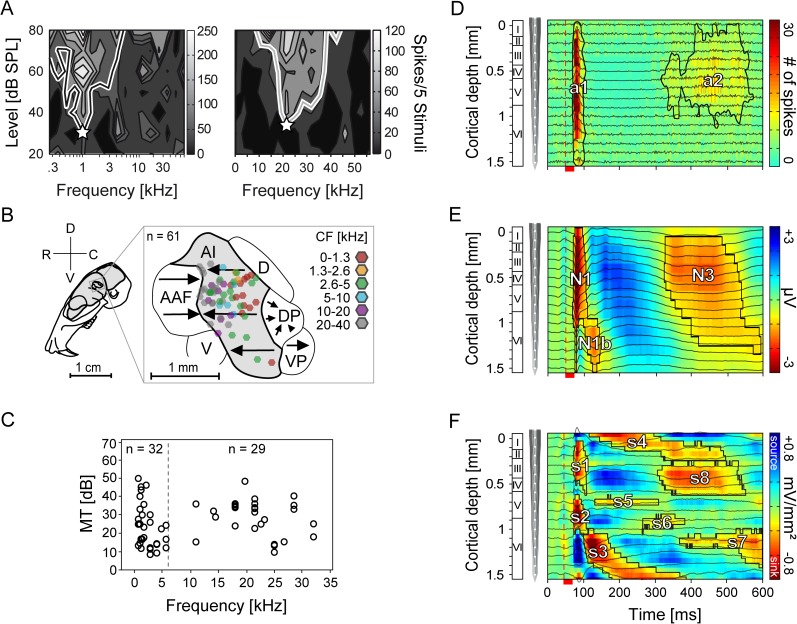
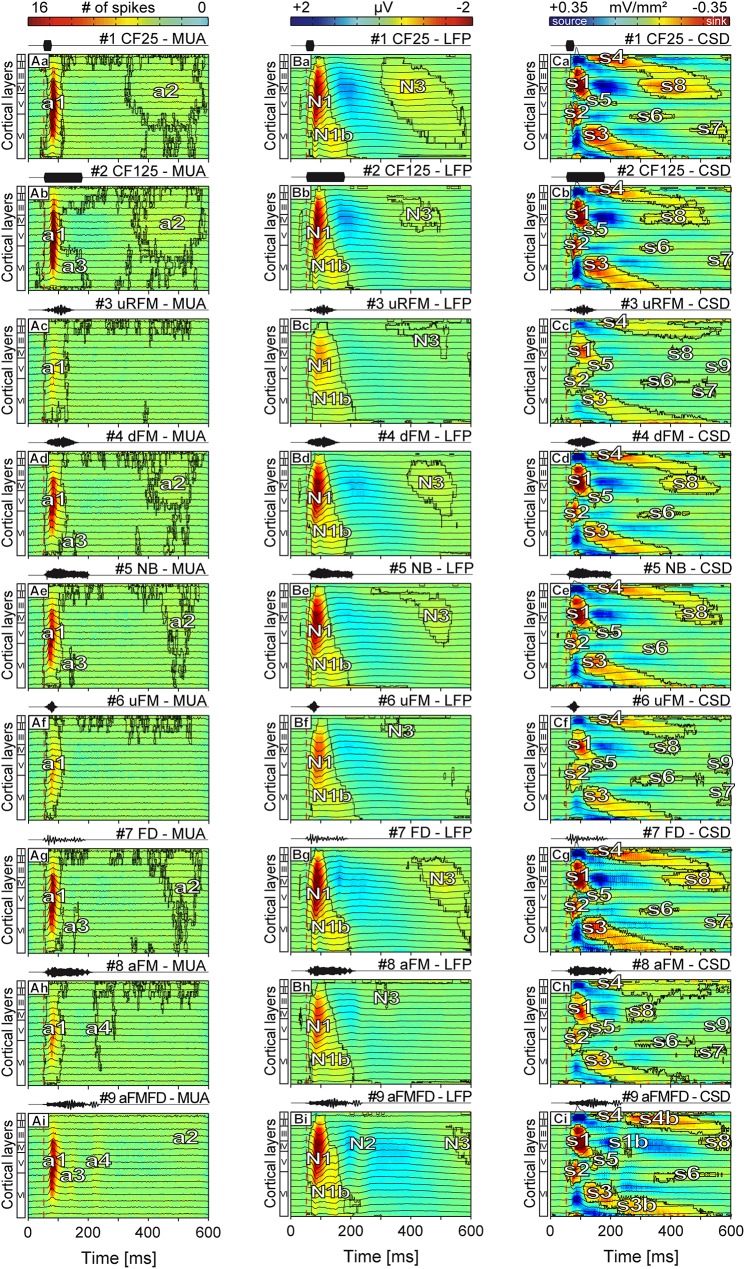
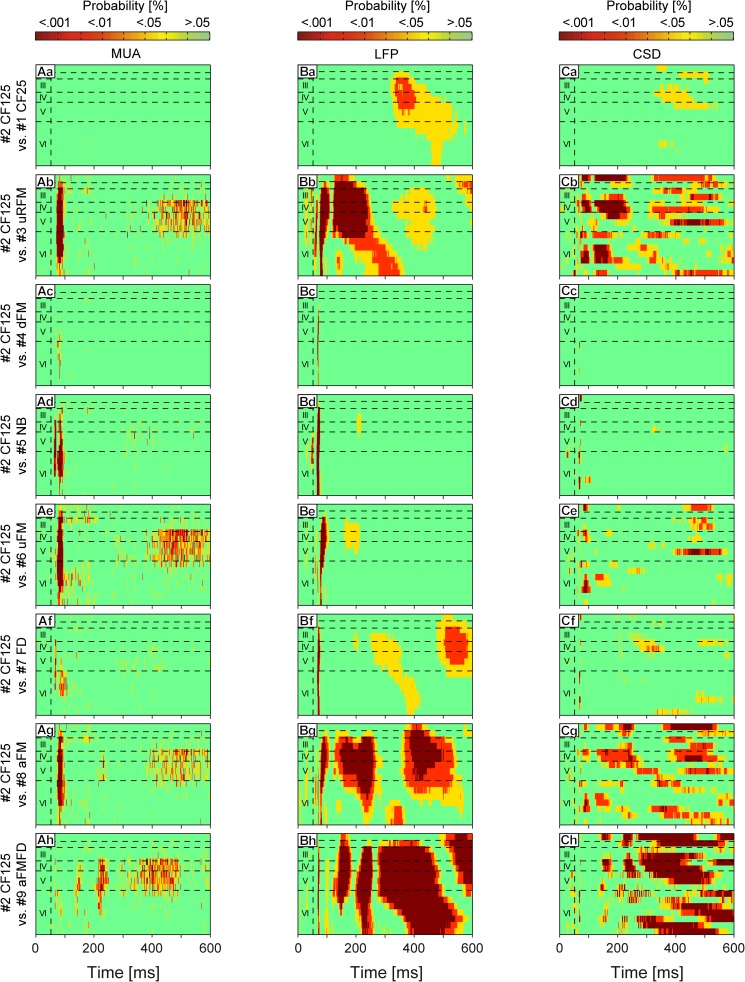
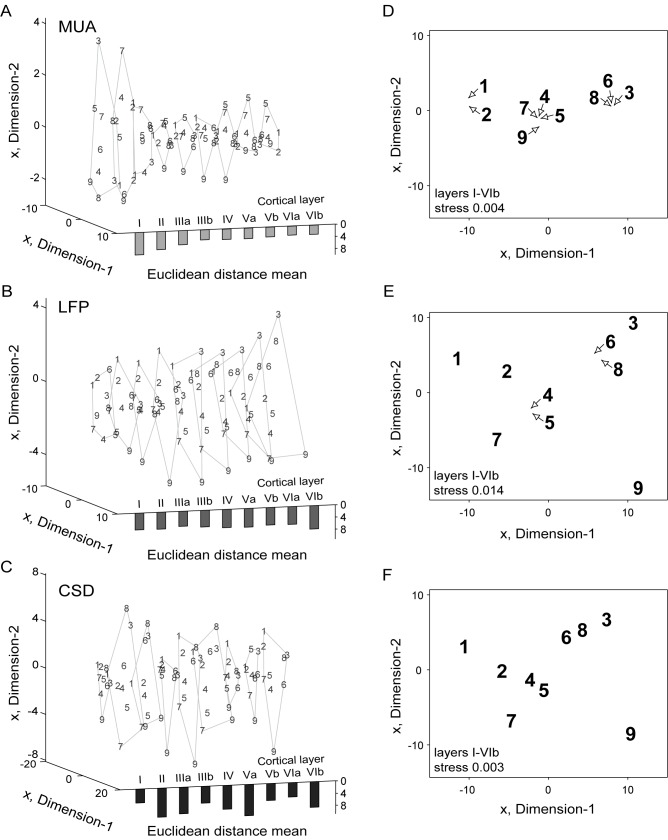
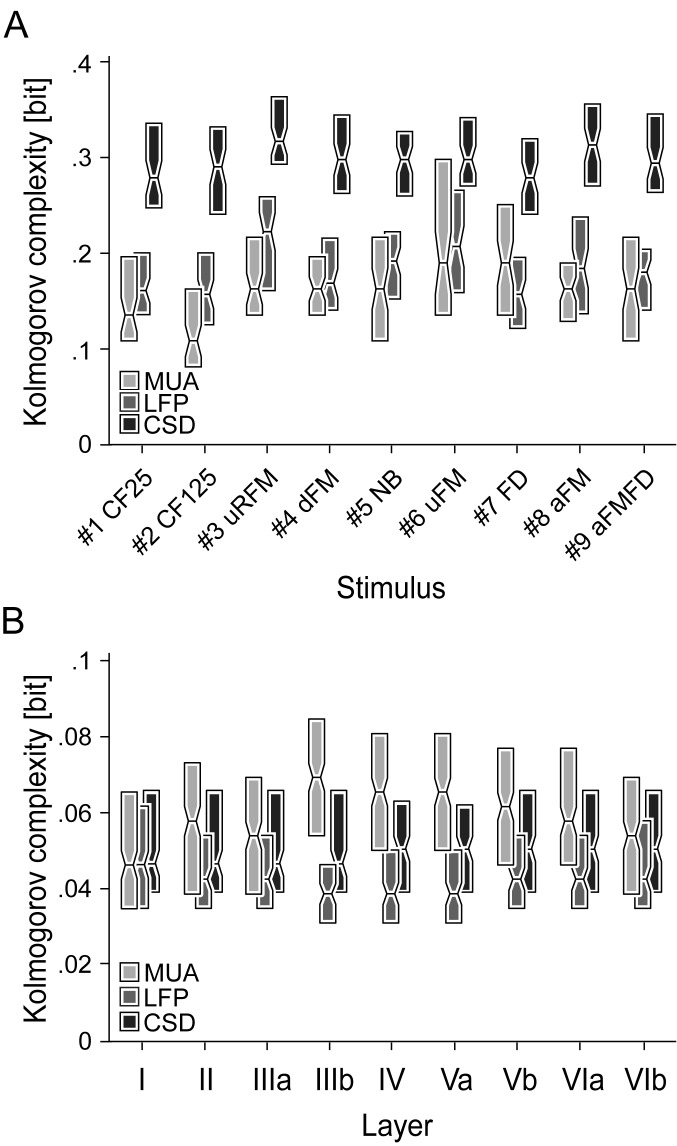
In mammals, acoustic communication plays an important role during social behaviors. Despite their ethological relevance, the mechanisms by which the auditory cortex represents different communication call properties remain elusive. Recent studies have pointed out that communication-sound encoding could be based on discharge patterns of neuronal populations. Following this idea, we investigated whether the activity of local neuronal networks, such as those occurring within individual cortical columns, is sufficient for distinguishing between sounds that differed in their spectro-temporal properties. To accomplish this aim, we analyzed simple pure-tone and complex communication call elicited multi-unit activity (MUA) as well as local field potentials (LFP), and current source density (CSD) waveforms at the single-layer and columnar level from the primary auditory cortex of anesthetized Mongolian gerbils. Multi-dimensional scaling analysis was used to evaluate the degree of "call-specificity" in the evoked activity. The results showed that whole laminar profiles segregated 1.8-2.6 times better across calls than single-layer activity. Also, laminar LFP and CSD profiles segregated better than MUA profiles. Significant differences between CSD profiles evoked by different sounds were more pronounced at mid and late latencies in the granular and infragranular layers and these differences were based on the absence and/or presence of current sinks and on sink timing. The stimulus-specific activity patterns observed within cortical columns suggests that the joint activity of local cortical populations (as local as single columns) could indeed be important for encoding sounds that differ in their acoustic attributes.


Conflict of interest statement

Competing Interests: The authors have declared that no competing interests exist.

Figures

Fig 1
Fig 1. Pure-tones and communication sounds of Mongolian gerbils.
Panels show the oscillograms (top) and the corresponding spectrograms (bottom) of each stimulus used in the present study. In addition to the pure-tone controls of 25 and 125 ms duration [#1 CF25 (A) and #2 CF125 (B)], multiharmonic sounds emitted during mating and discomfort [#3 uRFM (C)], isolation [#4 dFM (D)], agonistic interaction [#5 NB (E)], non-conflict mating [#6 uFM (F)], and alarm behavior [#7 FD (G), #8 aFM (H), and #9 aFMFD (I)] were presented. All communication sounds were recorded from the same breeding colony which was used for the experiments. The set of sounds was chosen to cover the species-specific variety of different spectro-temporal properties.
Fig 2
Fig 2. Frequency tuning and cortical location of neurons and representative laminar MUA, LFP, and CSD profiles.
(A) The left and right graphic shows two representative MUA-based tuning curves obtained from neurons in layer IV of the same animal. The white asterisks represent the CF located at 1 and 21 kHz, respectively. (B) Figure shows the color-coded locations of the recording sites within the schematic representation of the parcellation of the auditory cortex [(AAF (anterior auditory field), AI (primary auditory cortex), D (dorsal field), DP (dorsoposterior field), V (ventral field), VP (ventroposterior field)]. Arrows indicate the tonotopic organized cortical areas. All laminar tracks (n = 61) were recorded within the AI and marked as hexagons whose color represents the characteristic frequency (CF). Adapted from [–52] and reprinted from the open access journal [49] under a CC BY license. (C) The figure displays the median characteristic frequency (CF) against the median minimum threshold (MT) of tuning curves interpolated from neuronal spike responses of layers III-VIa. The high/low CF border was defined at 6 kHz (dashed line). (D, E) Graphics show single laminar profiles (averaged over 50 trials) of one cortical site constructed from the neuronal activity filtered at 300-4500 Hz for MUA (D) and 0.1-300 Hz for LFP (E) recorded from the same location tuned to 1.4 kHz with a linear-array multicontact electrode covering all six cortical layers. Neuronal recordings were obtained simultaneously at 16 depths (black traces) at an interchannel distance of 100 μm and represented as a colormap in the background. (F) The single CSD profile was calculated from the second spatial derivative of the local field potentials (E). Red colored current sinks labeled as s1 to s8 are classically interpreted as net inward transmembrane currents and current sources (blue) as net outward currents. Contours enclosing the neuronal activity were calculated at 6 spikes (MUA, a1 and a2) and 20% (LFP, N1, N1b, and N3) or 10% (CSD, s1-s8) of the maximum negative amplitude of the respective profile. The vertical dashed line marks the beginning of pure-tone stimulation (1.4 kHz; 80 dB SPL). Red scale bar represents the stimulus duration of 25 ms.
Fig 3
Fig 3. Median laminar MUA, LFP and CSD profiles of stimulus-evoked recordings.
Each point in the profiles represents the median of the averaged (n = 61) depth-adjusted MUA (Aa-Ai), LFP (Ba-Bi), and CSD (Ca-Ci) in the response to two pure tones (rows 1-2) and 7 different spectro-temporally complex sounds (rows 3-9). Contours enclosing the neuronal activity (a1-a4) in the MUA profiles were calculated at a threshold of 4 spikes whereas contours in the LFP (N1-N3) and CSD profiles (s1-s9) were calculated at a threshold of 5% of the maximum negative amplitude of the respective LFP or CSD profile. While the overall laminar structure remains similar most of the MUA, LFP, and CSD profiles show characteristic stimulus-specific differences. Most of the activity responsible for these differences is found at > 100 ms post stimulus. A stimulus frequency dependent dissimilarity in the MUA strength and profile structure is prominent in (Ac), (Af), and (Ah). The vertical dashed line marks the beginning of stimulation. Corresponding oscillograms of stimuli are shown above the profiles.
Fig 4
Fig 4. Statistical comparison between laminar MUA, LFP, and CSD profiles.
A parametric repeated measures ANOVA in combination with a false discovery rate post-hoc test was applied for 61 measurement points at each of the 600 time points and all 16 channels of the MUAs (Aa-Ah); the LFPs (Ba-Bh), and the CSDs (Ca-Ch). The profile evoked by stimulus #2 CF125 was set as control and tested against all remaining profiles. The points in the profiles represent the probability values (green: p ≥ 0.05; yellow: p < 0.05; red: p < 0.01; dark red: p < 0.001). Horizontal dashed lines indicate layer borders while the vertical dashed line marks the beginning of stimulation.
Fig 5
Fig 5. Multi-dimensional scaling (MDS) of averaged stimulus-evoked responses.
Graphics display the two-dimensional MDS of the averaged responses of each layer (A-C) and the median MUA (D), LFP (E), and CSD (F) profiles of all layers. In (A-C) layers are indicated with Roman numerals. (A-F) Arabic numbers represent the stimuli eliciting the respective waveforms/profiles. (D-F) Arrows point to the actual position of profiles. Solid lines in the left graphics (A-C) indicate the outer borders of the layer-wise MDS. The mean of all Euclidean distances between the waveforms elicited by stimuli #1-#9 are displayed as bars at the bottom for each layer. The averaged waveforms or profiles were normalized to the respective stimulus-independent maximum value before calculation. The degree of dissimilarity between LFP and CSD waveforms/profiles is increased in comparison to the MUA. The whole laminar profiles segregate 2.3 (MUA), 2.6 (LFP), or 1.8 (CSD) times better across different calls than single-layer activity.
Fig 6
Fig 6. Kolmogorov complexity of layer-specific waveforms and laminar LFP, CSD, and MUA profiles.
The Kolmogorov complexity indicating the compressibility of binary data is shown as color-coded boxplots for each stimulus (A) or layer (B). In (B) the responses to all stimuli at each layer were pooled together. Edge of box represents second and fourth quartiles and midline represents median of data. Binary transformation border was set at 0 for LFP and CSD waveforms and at two times the individual median for MUA waveforms. The stimulus-specific Kolmogorov complexity is highest for CSD profiles indicating a high structural complexity. The expectedly overall lower Kolmogorov complexity for stimulus-unspecific single layer waveforms is comparable in layers I-IIIa, but ranks as MUA > CSD > LFP in the remaining layers IIIb-VIb.

Similar articles

Cited by

References

    1. Winter P, Funkenstein HH. The effect of species-specific vocalization on the discharge of auditory cortical cells in the awake squirrel monkey. (Saimiri sciureus). Exp Brain Res. 1973;18(5):489–504. Epub 1973/12/20. . - PubMed
    1. Rauschecker JP. Cortical processing of complex sounds. Curr Opin Neurobiol. 1998;8(4):516–21. Epub 1998/09/30. . - PubMed
    1. Rauschecker JP. Processing of complex sounds in the auditory cortex of cat, monkey, and man. Acta Otolaryngol Suppl. 1997;532:34–8. Epub 1997/01/01. . - PubMed
    1. Kanwal JS, Rauschecker JP. Auditory cortex of bats and primates: managing species-specific calls for social communication. Frontiers in Bioscience. 2007;12:4621–40. doi: 10.2741/2413 - DOI - PMC - PubMed
    1. Steinschneider M, Arezzo J, Vaughan HG Jr. Speech evoked activity in the auditory radiations and cortex of the awake monkey. Brain Res. 1982;252(2):353–65. Epub 1982/12/09. . - PubMed

MeSH terms

LinkOut - more resources