

Altitudinal gradients, biogeographic history and microhabitat adaptation affect fine-scale spatial genetic structure in African and Neotropical populations of an ancient tropical tree species
- PMID: 28771629
- PMCID: PMC5542443
- DOI: 10.1371/journal.pone.0182515
Altitudinal gradients, biogeographic history and microhabitat adaptation affect fine-scale spatial genetic structure in African and Neotropical populations of an ancient tropical tree species
Abstract
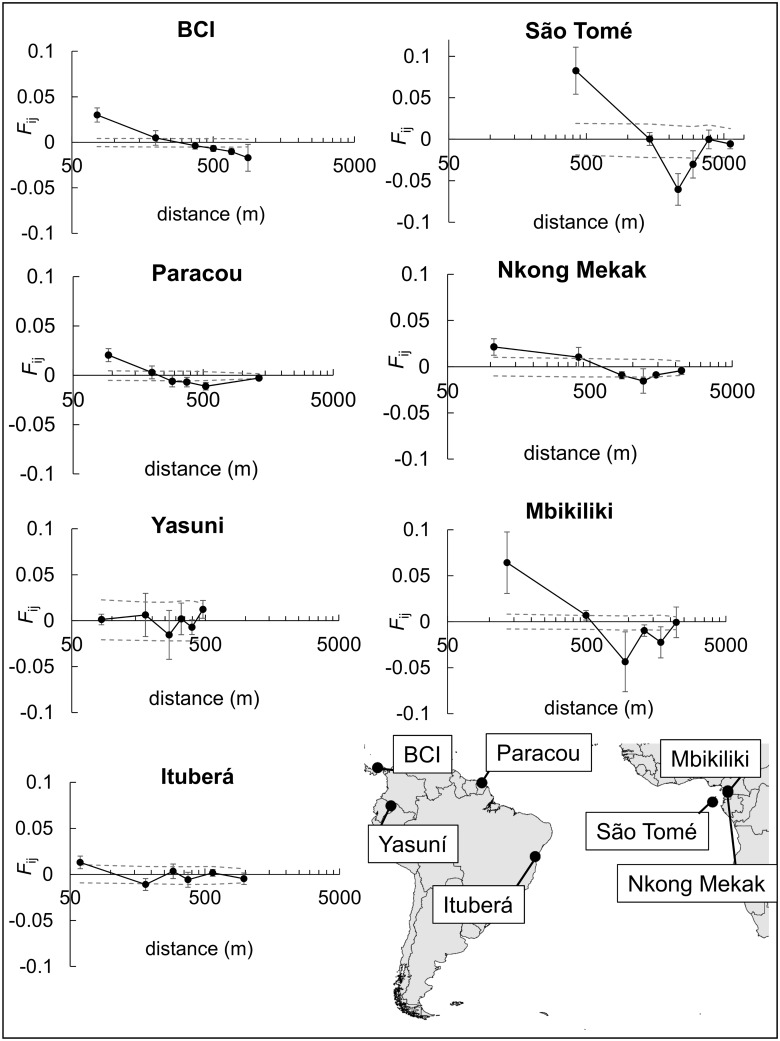
The analysis of fine-scale spatial genetic structure (FSGS) within populations can provide insights into eco-evolutionary processes. Restricted dispersal and locally occurring genetic drift are the primary causes for FSGS at equilibrium, as described in the isolation by distance (IBD) model. Beyond IBD expectations, spatial, environmental or historical factors can affect FSGS. We examined FSGS in seven African and Neotropical populations of the late-successional rain forest tree Symphonia globulifera L. f. (Clusiaceae) to discriminate the influence of drift-dispersal vs. landscape/ecological features and historical processes on FSGS. We used spatial principal component analysis and Bayesian clustering to assess spatial genetic heterogeneity at SSRs and examined its association with plastid DNA and habitat features. African populations (from Cameroon and São Tomé) displayed a stronger FSGS than Neotropical populations at both marker types (mean Sp = 0.025 vs. Sp = 0.008 at SSRs) and had a stronger spatial genetic heterogeneity. All three African populations occurred in pronounced altitudinal gradients, possibly restricting animal-mediated seed dispersal. Cyto-nuclear disequilibria in Cameroonian populations also suggested a legacy of biogeographic history to explain these genetic patterns. Conversely, Neotropical populations exhibited a weaker FSGS, which may reflect more efficient wide-ranging seed dispersal by Neotropical bats and other dispersers. The population from French Guiana displayed an association of plastid haplotypes with two morphotypes characterized by differential habitat preferences. Our results highlight the importance of the microenvironment for eco-evolutionary processes within persistent tropical tree populations.
Conflict of interest statement
Figures


Similar articles
-
Molecular systematic analysis reveals cryptic tertiary diversification of a widespread tropical rain forest tree.Am Nat. 2003 Dec;162(6):691-703. doi: 10.1086/379795. Epub 2003 Nov 4. Am Nat. 2003. PMID: 14737707
-
Development of genomic tools in a widespread tropical tree, Symphonia globulifera L.f.: a new low-coverage draft genome, SNP and SSR markers.Mol Ecol Resour. 2017 Jul;17(4):614-630. doi: 10.1111/1755-0998.12605. Epub 2016 Oct 27. Mol Ecol Resour. 2017. PMID: 27718316
-
The ancient tropical rainforest tree Symphonia globulifera L. f. (Clusiaceae) was not restricted to postulated Pleistocene refugia in Atlantic Equatorial Africa.Heredity (Edinb). 2013 Jul;111(1):66-76. doi: 10.1038/hdy.2013.21. Epub 2013 Apr 10. Heredity (Edinb). 2013. PMID: 23572126 Free PMC article.
-
Are patterns of fine-scale spatial genetic structure consistent between sites within tropical tree species?PLoS One. 2018 Mar 16;13(3):e0193501. doi: 10.1371/journal.pone.0193501. eCollection 2018. PLoS One. 2018. PMID: 29547644 Free PMC article.
-
The complex biogeographic history of a widespread tropical tree species.Evolution. 2008 Nov;62(11):2760-74. doi: 10.1111/j.1558-5646.2008.00506.x. Epub 2008 Sep 1. Evolution. 2008. PMID: 18764917
Cited by
-
Fine-scale spatial genetic structure across the species range reflects recent colonization of high elevation habitats in silver fir (Abies alba Mill.).Mol Ecol. 2021 Oct;30(20):5247-5265. doi: 10.1111/mec.16107. Epub 2021 Aug 20. Mol Ecol. 2021. PMID: 34365696 Free PMC article.
-
Multiscale spatial genetic structure within and between populations of wild cherry trees in nuclear genotypes and chloroplast haplotypes.Ecol Evol. 2019 Sep 4;9(19):11266-11276. doi: 10.1002/ece3.5628. eCollection 2019 Oct. Ecol Evol. 2019. PMID: 31641471 Free PMC article.
-
Microgeographic local adaptation and ecotype distributions: The role of selective processes on early life-history traits in sympatric, ecologically divergent Symphonia populations.Ecol Evol. 2020 Sep 17;10(19):10735-10753. doi: 10.1002/ece3.6731. eCollection 2020 Oct. Ecol Evol. 2020. PMID: 33072293 Free PMC article.
-
Genetic diversity and fine-scale spatial genetic structure of European beech populations along an elevational gradient.Heredity (Edinb). 2025 Aug;134(8):451-460. doi: 10.1038/s41437-025-00776-8. Epub 2025 Jun 26. Heredity (Edinb). 2025. PMID: 40571728 Free PMC article.
-
Hybridization and geographic distribution shapes the spatial genetic structure of two co-occurring orchid species.Heredity (Edinb). 2019 Oct;123(4):458-469. doi: 10.1038/s41437-019-0254-7. Epub 2019 Aug 7. Heredity (Edinb). 2019. PMID: 31391556 Free PMC article.
References
-
- Vekemans X, Hardy OJ. New insights from fine-scale spatial genetic structure analyses in plant populations. Mol Ecol. 2004;13: 921–935. doi: 10.1046/j.1365-294X.2004.02076.x - DOI - PubMed
-
- Degen B, Blanc L, Caron H, Maggia L, Kremer A, Gourlet-Fleury S. Impact of selective logging on genetic composition and demographic structure of four tropical tree species. Biol Conserv. 2006;131: 386–401. doi: 10.1016/j.biocon.2006.02.014 - DOI
-
- Meirmans PG. The trouble with isolation by distance. Mol Ecol. 2012;21: 2839–2846. doi: 10.1111/j.1365-294X.2012.05578.x - DOI - PubMed
-
- Malécot G. Quelques schémas probabilistes sur la variabilité des populations naturelles. Annales de l´Université de Lyon. 1951;13: 339–340.
MeSH terms
LinkOut - more resources
Full Text Sources
Other Literature Sources
