HDAC3 negatively regulates spatial memory in a mouse model of Alzheimer's disease
- PMID: 28771976
- PMCID: PMC5595690
- DOI: 10.1111/acel.12642
HDAC3 negatively regulates spatial memory in a mouse model of Alzheimer's disease
Abstract
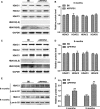
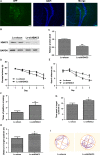
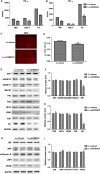
The accumulation and deposition of beta-amyloid (Aβ) is a key neuropathological hallmark of Alzheimer's disease (AD). Histone deacetylases (HDACs) are promising therapeutic targets for the treatment of AD, while the specific HDAC isoforms associated with cognitive improvement are poorly understood. In this study, we investigate the role of HDAC3 in the pathogenesis of AD. Nuclear HDAC3 is significantly increased in the hippocampus of 6- and 9-month-old APPswe/PS1dE9 (APP/PS1) mice compared with that in age-matched wild-type C57BL/6 (B6) mice. Lentivirus -mediated inhibition or overexpression of HDAC3 was used in the hippocampus of APP/PS1 mice to investigate the role of HDAC3 in spatial memory, amyloid burden, dendritic spine density, glial activation and tau phosphorylation. Inhibition of HDAC3 in the hippocampus attenuates spatial memory deficits, as indicated in the Morris water maze test, and decreases amyloid plaque load and Aβ levels in the brains of APP/PS1 mice. Dendritic spine density is increased, while microglial activation is alleviated after HDAC3 inhibition in the hippocampus of 9-month-old APP/PS1 mice. Furthermore, HDAC3 overexpression in the hippocampus increases Aβ levels, activates microglia, and decreases dendritic spine density in 6-month-old APP/PS1 mice. In conclusion, our results indicate that HDAC3 negatively regulates spatial memory in APP/PS1 mice and HDAC3 inhibition might represent a potential therapy for the treatment of AD.
Keywords: Alzheimer's disease; beta-amyloid; histone deacetylase3; spatial memory.
© 2017 The Authors. Aging Cell published by the Anatomical Society and John Wiley & Sons Ltd.
Figures


Similar articles
-
Inhibition of HDAC3 reverses Alzheimer's disease-related pathologies in vitro and in the 3xTg-AD mouse model.Proc Natl Acad Sci U S A. 2018 Nov 20;115(47):E11148-E11157. doi: 10.1073/pnas.1805436115. Epub 2018 Nov 5. Proc Natl Acad Sci U S A. 2018. Retraction in: Proc Natl Acad Sci U S A. 2024 Aug 27;121(35):e2415279121. doi: 10.1073/pnas.2415279121. PMID: 30397132 Free PMC article. Retracted.
-
Lentivirus-Mediated HDAC3 Inhibition Attenuates Oxidative Stress in APPswe/PS1dE9 Mice.J Alzheimers Dis. 2018;61(4):1411-1424. doi: 10.3233/JAD-170844. J Alzheimers Dis. 2018. PMID: 29376873
-
Histone deacetylase-3 regulates the expression of the amyloid precursor protein and its inhibition promotes neuroregenerative pathways in Alzheimer's disease models.FASEB J. 2024 May 31;38(10):e23659. doi: 10.1096/fj.202301762RR. FASEB J. 2024. PMID: 38733301
-
Effects of CX3CR1 and Fractalkine Chemokines in Amyloid Beta Clearance and p-Tau Accumulation in Alzheimer's Disease (AD) Rodent Models: Is Fractalkine a Systemic Biomarker for AD?Curr Alzheimer Res. 2016;13(4):403-12. doi: 10.2174/1567205013666151116125714. Curr Alzheimer Res. 2016. PMID: 26567742 Review.
-
Molecular Insight into the Therapeutic Promise of Flavonoids against Alzheimer's Disease.Molecules. 2020 Mar 11;25(6):1267. doi: 10.3390/molecules25061267. Molecules. 2020. PMID: 32168835 Free PMC article. Review.
Cited by
-
Inhibition of HDAC3 reverses Alzheimer's disease-related pathologies in vitro and in the 3xTg-AD mouse model.Proc Natl Acad Sci U S A. 2018 Nov 20;115(47):E11148-E11157. doi: 10.1073/pnas.1805436115. Epub 2018 Nov 5. Proc Natl Acad Sci U S A. 2018. Retraction in: Proc Natl Acad Sci U S A. 2024 Aug 27;121(35):e2415279121. doi: 10.1073/pnas.2415279121. PMID: 30397132 Free PMC article. Retracted.
-
The Two Faces of HDAC3: Neuroinflammation in Disease and Neuroprotection in Recovery.Epigenomics. 2024 Nov-Nov;16(21-22):1373-1388. doi: 10.1080/17501911.2024.2419357. Epub 2024 Nov 8. Epigenomics. 2024. PMID: 39513228 Review.
-
Low-dose dietary vorinostat increases brain histone acetylation levels and reduces oxidative stress in an Alzheimer's disease mouse model.J Alzheimers Dis. 2025 Aug;106(4):1360-1382. doi: 10.1177/13872877251352107. Epub 2025 Jul 1. J Alzheimers Dis. 2025. PMID: 40598871 Free PMC article.
-
System-Level Analysis of Alzheimer's Disease Prioritizes Candidate Genes for Neurodegeneration.Front Genet. 2021 Apr 6;12:625246. doi: 10.3389/fgene.2021.625246. eCollection 2021. Front Genet. 2021. PMID: 33889174 Free PMC article.
-
Beneficial Effects of Spirulina Consumption on Brain Health.Nutrients. 2022 Feb 5;14(3):676. doi: 10.3390/nu14030676. Nutrients. 2022. PMID: 35277035 Free PMC article. Review.
References
-
- Alzheimer's A (2015) 2015 Alzheimer's disease facts and figures. Alzheimers Dement. 11, 332–384. - PubMed
-
- Benito E, Urbanke H, Ramachandran B, Barth J, Halder R, Awasthi A, Jain G, Capece V, Burkhardt S, Navarro‐Sala M, Nagarajan S, Schutz AL, Johnsen SA, Bonn S, Luhrmann R, Dean C, Fischer A (2015) HDAC inhibitor‐dependent transcriptome and memory reinstatement in cognitive decline models. J. Clin. Investig. 125, 3572–3584. - PMC - PubMed
Publication types
MeSH terms
Substances
LinkOut - more resources
Full Text Sources
Other Literature Sources
Medical
Molecular Biology Databases

