. 2017 Sep:264:58-66.
doi: 10.1016/j.atherosclerosis.2017.07.024. Epub 2017 Jul 22.

Family-specific aggregation of lipid GWAS variants confers the susceptibility to familial hypercholesterolemia in a large Austrian family

Affiliations

Family-specific aggregation of lipid GWAS variants confers the susceptibility to familial hypercholesterolemia in a large Austrian family

Elina Nikkola et al. Atherosclerosis. 2017 Sep.

Abstract

Background and aims: Hypercholesterolemia confers susceptibility to cardiovascular disease (CVD). Both serum total cholesterol (TC) and LDL-cholesterol (LDL-C) exhibit a strong genetic component (heritability estimates 0.41-0.50). However, a large part of this heritability cannot be explained by the variants identified in recent extensive genome-wide association studies (GWAS) on lipids. Our aim was to find genetic causes leading to high LDL-C levels and ultimately CVD in a large Austrian family presenting with what appears to be autosomal dominant inheritance for familial hypercholesterolemia (FH).

Methods: We utilized linkage analysis followed by whole-exome sequencing and genetic risk score analysis using an Austrian multi-generational family with various dyslipidemias, including elevated TC and LDL-C, and one family branch with elevated lipoprotein (a) (Lp(a)).

Results: We did not find evidence for genome-wide significant linkage for LDL-C or apparent causative variants in the known FH genes rather, we discovered a particular family-specific combination of nine GWAS LDL-C SNPs (p = 0.02 by permutation), and putative less severe familial hypercholesterolemia mutations in the LDLR and APOB genes in a subset of the affected family members. Separately, high Lp(a) levels observed in one branch of the family were explained primarily by the LPA locus, including short (<23) Kringle IV repeats and rs3798220.

Conclusions: Taken together, some forms of FH may be explained by family-specific combinations of LDL-C GWAS SNPs.

Keywords: Familial hypercholesterolemia (FH); Genetic risk score (GRS); LDL cholesterol; Lipoprotein (a).


Conflict of interest statement

Conflict of interest

The authors declared they do not have anything to disclose regarding conflict of interest with respect to this manuscript.

Figures

Figure 1
Figure 1. The Austrian hypercholesterolemia family showing an autosomal dominant type of inheritance
The figure includes only those family members who gave an informed consent for blood sampling and DNA analyses. The DNA sample from the affected family member 7711 did not pass the quality requirements for the genomic analyses. The right bottom corner shows the explanations of the used signs: the circles indicate a female and the square a male; the filled circle or square indicates a person who has suffered from a previous cardiovascular event; the half-filled circle or square indicates an individual with high low-density lipoprotein cholesterol (LDL-C); yellow color indicates an individual with high lipoprotein (a) (Lp(a)); the red arrow shows individuals with DNA available; and the open squares or circles indicate unaffected subjects. The family-specific genetic risk score (GRS) and percentile are given under each individual. The individuals with specific APOB and LDLR variant combinations are circled in black (for the specific APOB and LDLR combinations, see Supplementary Table 3). The pedigree was drawn using CraneFoot (36).
Fig. 2
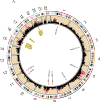
Fig. 2. Overview of the genetic results
(A) Overlap between the 22 LDL-C regions with an LOD score >1.0, exome variants (non-synonymous or frameshift variants with a MAF<10%), and 9 family-specific LDL-C GWAS variants identified in the Austrian family members, as illustrated by rCircos (37). The outer most track indicates the chromosome number, followed by the cytoband; the scatter plot shows the LOD scores of the ~95K SNPs from the linkage analysis (red indicates a LOD score >1.0 using a scale of 0–2.25); next to the scatter plot are the exome variants predominantly present in the affected family members (Supplementary Table 2) that reside in the regions with LOD>1.0; the inner most track indicates the 9 family-specific GWAS SNPs (Table 2), and the gene names (or the closest gene) of the variants are shown inside of the circle; the yellow highlight indicates that the variant was identified by exome sequencing. (B) Overlap between the Lp(a) regions with an LOD score >1.0 and exome variants (potentially functional and MAF<10%) identified in the Austrian family members, as illustrated by rCircos (37). The outer most track indicates the chromosome number, followed by the cytoband; the scatter plot shows the LOD scores of the ~95K SNPs from the linkage analysis (red indicates a LOD >1.0, using a scale of 0–1.5); and the inner most track indicates the exome variants present only in the family members with high Lp(a).

References

    1. Mendis S, Puska P, Norrving B. Global atlas on cardiovascular disease prevention and control. World Heal Organ. 2011:2–14.
    1. Fischer M, Broeckel U, Holmer S, Baessler A, Hengstenberg C, et al. Distinct heritable patterns of angiographic coronary artery disease in families with myocardial infarction. Circulation. 2005;111(7):855–62. doi: 10.1161/01.CIR.0000155611.41961.BB. - DOI - PubMed
    1. Zdravkovic S, Wienke A, Pedersen NL, Marenberg ME, Yashin AI, De Faire U. Heritability of death from coronary heart disease: A 36-year follow-up of 20 966 Swedish twins. J Intern Med. 2002;252(3):247–54. - PubMed
    1. Deloukas P, Kanoni S, Willenborg C, Farrall M, Assimes TL, et al. Large-scale association analysis identifies new risk loci for coronary artery disease. Nat Genet. 2013;45(1):25–33. doi: 10.1038/ng.2480. - DOI - PMC - PubMed
    1. Santos RD, Gidding SS, Hegele RA, Cuchel MA, Barter PJ, et al. Defining severe familial hypercholesterolaemia and the implications for clinical management: a consensus statement from the International Atherosclerosis Society Severe Familial Hypercholesterolemia Panel. Lancet Diabetes Endocrinol. Elsevier Ltd. 2016;8587(16):19–21. doi: 10.1016/S2213-8587(16)30041-9. - DOI - PubMed

MeSH terms