

An LC/MS/MS method for quantitation of chemopreventive sphingadienes in food products and biological samples
- PMID: 28772225
- PMCID: PMC5656051
- DOI: 10.1016/j.jchromb.2017.07.040
An LC/MS/MS method for quantitation of chemopreventive sphingadienes in food products and biological samples
Abstract
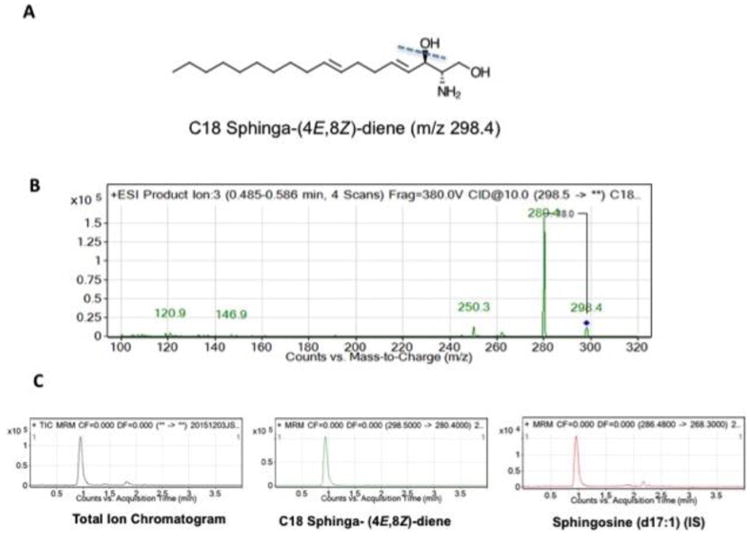
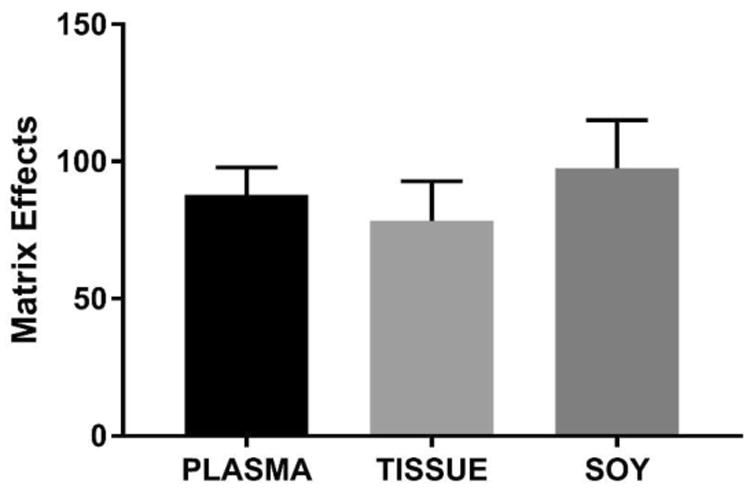
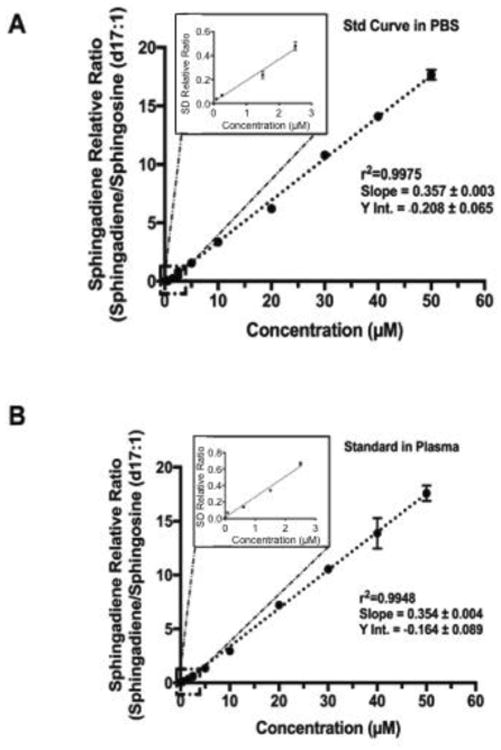
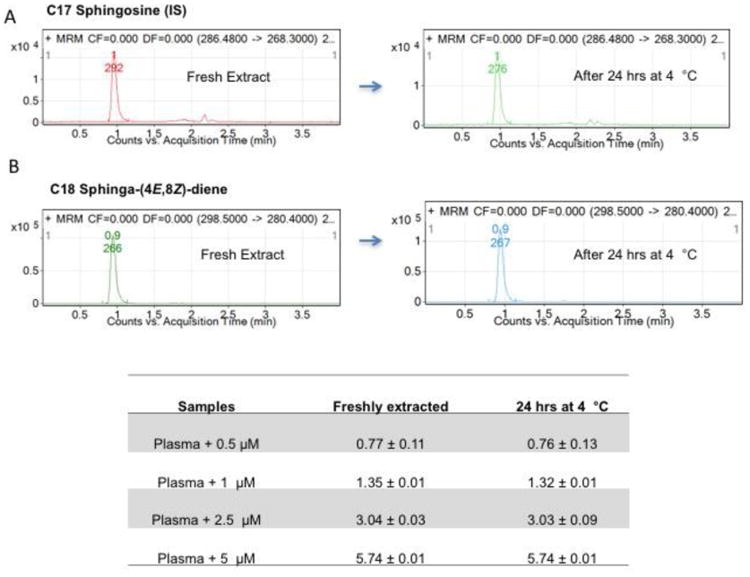
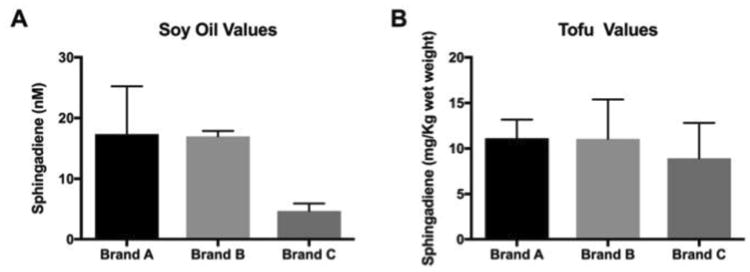
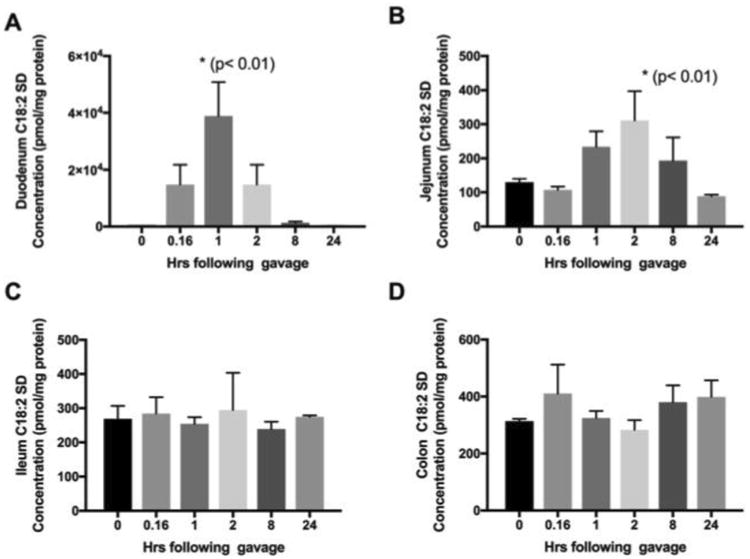
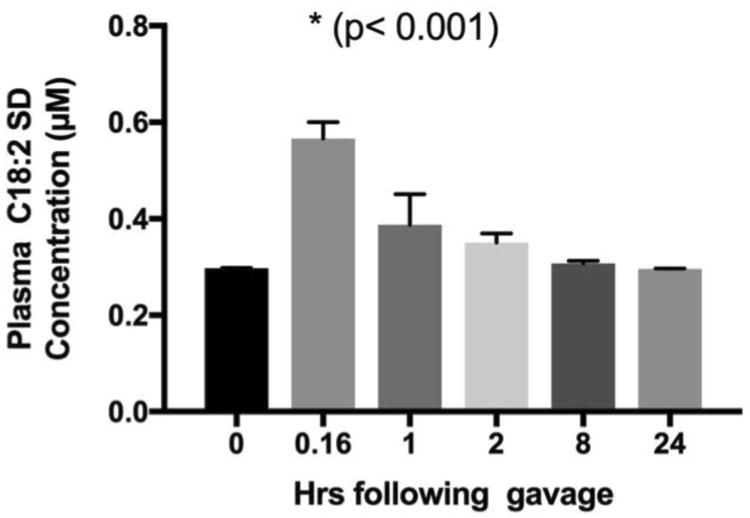
Colorectal cancer (CRC) is a leading cause of cancer mortality. Diet has a significant influence on colon cancer risk. Identifying chemopreventive agents, dietary constituents, practices and/or diet supplements that promote gut health and reduce the incidence of intestinal neoplasias and CRC could significantly impact public health. Sphingadienes (SDs) are dietary sphingolipids found in plant-based food products. SDs are cytotoxic to colon cancer cells and exhibit chemopreventive properties. The aim of the present study was to develop a sensitive and robust ultra-high performance liquid chromatography tandem mass spectrometry (UHPLC-MS/MS) method for quantifying SDs in food products and biological samples. The assay was linear over a concentration range of 80nM to 50μM and was sensitive to a detection limit of 3.3nM. Post-extraction stability was 100% at 24h. SD content in soy oils was approximately 10nM. SDs were detected transiently in the plasma of adult mice 10min after gavage delivery of a 25mg/kg bolus and declined to baseline by 1h. SD uptake in the gut was maximal in the duodenum and peaked 1h after gavage delivery. Disappearance of SDs in the lower gastrointestinal tract suggests either rapid metabolism to yet unidentified products or potentially luminal export.
Keywords: Chemoprevention; Colon cancer; Mass spectrometry; Soy; Sphingadienes; Sphingolipids.
Copyright © 2017 Elsevier B.V. All rights reserved.
Figures
Similar articles
-
Simultaneous Quantitation of Advanced Glycation End Products in Soy Sauce and Beer by Liquid Chromatography-Tandem Mass Spectrometry without Ion-Pair Reagents and Derivatization.J Agric Food Chem. 2016 Nov 9;64(44):8397-8405. doi: 10.1021/acs.jafc.6b02500. Epub 2016 Oct 31. J Agric Food Chem. 2016. PMID: 27771957
-
Determination of nicotianamine in soy sauce and other plant-based foods by LC-MS/MS.J Agric Food Chem. 2012 Oct 10;60(40):10000-6. doi: 10.1021/jf3035868. Epub 2012 Oct 1. J Agric Food Chem. 2012. PMID: 23025624
-
Facile determination of sphingolipids under alkali condition using metal-free column by LC-MS/MS.Anal Bioanal Chem. 2018 Aug;410(20):4793-4803. doi: 10.1007/s00216-018-1116-5. Epub 2018 May 9. Anal Bioanal Chem. 2018. PMID: 29740670
-
Androgen glucuronides analysis by liquid chromatography tandem-mass spectrometry: could it raise new perspectives in the diagnostic field of hormone-dependent malignancies?J Chromatogr B Analyt Technol Biomed Life Sci. 2013 Dec 1;940:24-34. doi: 10.1016/j.jchromb.2013.09.022. Epub 2013 Sep 27. J Chromatogr B Analyt Technol Biomed Life Sci. 2013. PMID: 24140653 Review.
-
Ultra high performance liquid chromatography tandem mass spectrometry determination and profiling of prohibited steroids in human biological matrices. A review.J Chromatogr B Analyt Technol Biomed Life Sci. 2013 May 15;927:22-36. doi: 10.1016/j.jchromb.2012.12.003. Epub 2012 Dec 20. J Chromatogr B Analyt Technol Biomed Life Sci. 2013. PMID: 23317577 Review.
Cited by
-
The Importance of Reference Materials and Method Validation for Advancing Research on the Health Effects of Dietary Supplements and Other Natural Products.Front Nutr. 2021 Dec 14;8:786261. doi: 10.3389/fnut.2021.786261. eCollection 2021. Front Nutr. 2021. PMID: 34970578 Free PMC article. Review.
-
Sphingoid bases of dietary ceramide 2-aminoethylphosphonate, a marine sphingolipid, absorb into lymph in rats.J Lipid Res. 2019 Feb;60(2):333-340. doi: 10.1194/jlr.M085654. Epub 2018 Dec 14. J Lipid Res. 2019. PMID: 30552287 Free PMC article.
-
Sphingadienes show therapeutic efficacy in neuroblastoma in vitro and in vivo by targeting the AKT signaling pathway.Invest New Drugs. 2018 Oct;36(5):743-754. doi: 10.1007/s10637-017-0558-5. Epub 2018 Jan 16. Invest New Drugs. 2018. PMID: 29335887 Free PMC article.
-
The bioactive sphingolipid playbook. A primer for the uninitiated as well as sphingolipidologists.J Lipid Res. 2025 Jun;66(6):100813. doi: 10.1016/j.jlr.2025.100813. Epub 2025 Apr 18. J Lipid Res. 2025. PMID: 40254066 Free PMC article. Review.
-
Parallel Reaction Monitoring Mass Spectrometry for Rapid and Accurate Identification of β-Lactamases Produced by Enterobacteriaceae.Front Microbiol. 2022 Jun 20;13:784628. doi: 10.3389/fmicb.2022.784628. eCollection 2022. Front Microbiol. 2022. PMID: 35794914 Free PMC article.
References
-
- Schoen RE, Pinsky PF, Weissfeld JL, Yokochi LA, Church T, Laiyemo AO, Bresalier R, Andriole GL, Buys SS, Crawford ED, Fouad MN, Isaacs C, Johnson CC, Reding DJ, O'Brien B, Carrick DM, Wright P, Riley TL, Purdue MP, Izmirlian G, Kramer BS, Miller AB, Gohagan JK, Prorok PC, Berg CD Team, P.P. Colorectal-cancer incidence and mortality with screening flexible sigmoidoscopy. N Engl J Med. 2012;366:2345–2357. - PMC - PubMed
-
- Winawer SJ, Zauber AG. The advanced adenoma as the primary target of screening. Gastrointest Endosc Clin N Am. 2002;12:1–9. v. - PubMed
-
- Giovannucci E, Willett W. Dietary factors and risk of colon cancer. Ann Med. 1994;26:443–452. - PubMed
-
- Itano O, Fan K, Yang K, Suzuki K, Quimby F, Dong Z, Jin B, Edelmann W, Lipkin M. Effect of caloric intake on Western-style diet-induced intestinal tumors in a mouse model for hereditary colon cancer. Nutr Cancer. 2012;64:401–408. - PubMed
MeSH terms
Substances
Grants and funding
LinkOut - more resources
Full Text Sources
Other Literature Sources
