. 2017;9(6):529-545.
doi: 10.1159/000478042. Epub 2017 Aug 4.

Collectin-11 Is an Important Modulator of Retinal Pigment Epithelial Cell Phagocytosis and Cytokine Production

Affiliations

Collectin-11 Is an Important Modulator of Retinal Pigment Epithelial Cell Phagocytosis and Cytokine Production

Xia Dong et al. J Innate Immun. 2017.

Abstract

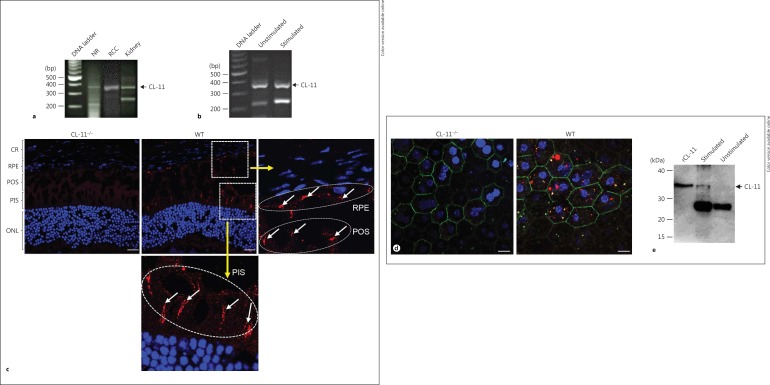
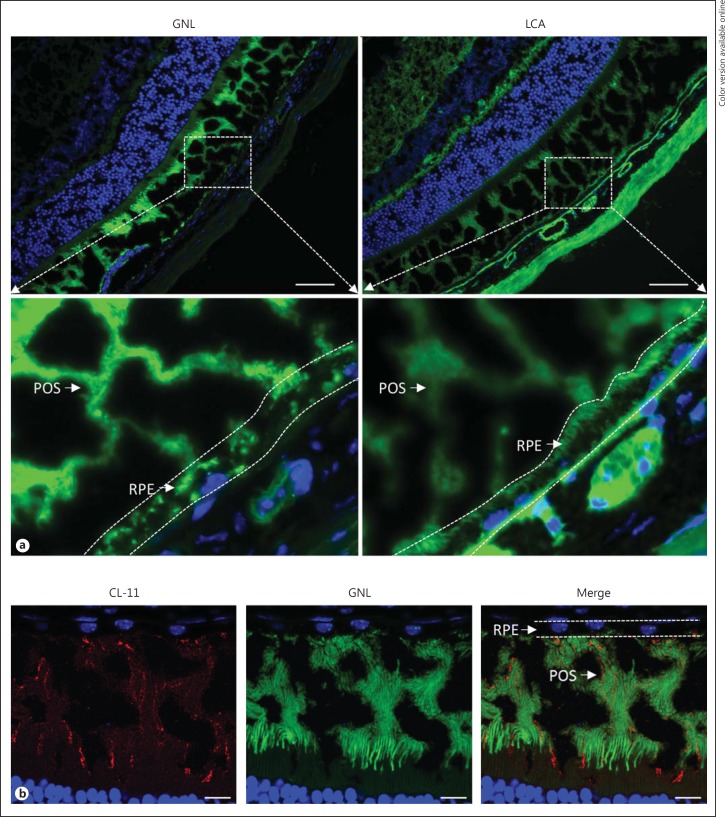
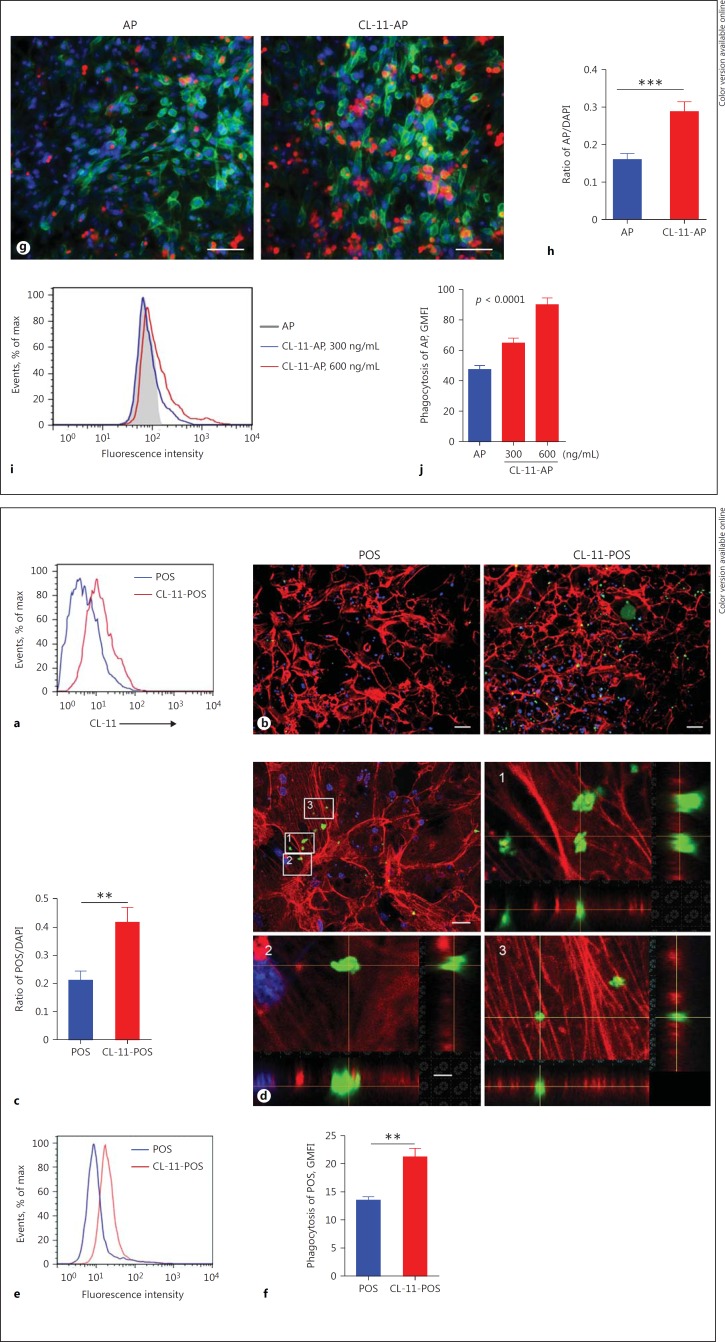
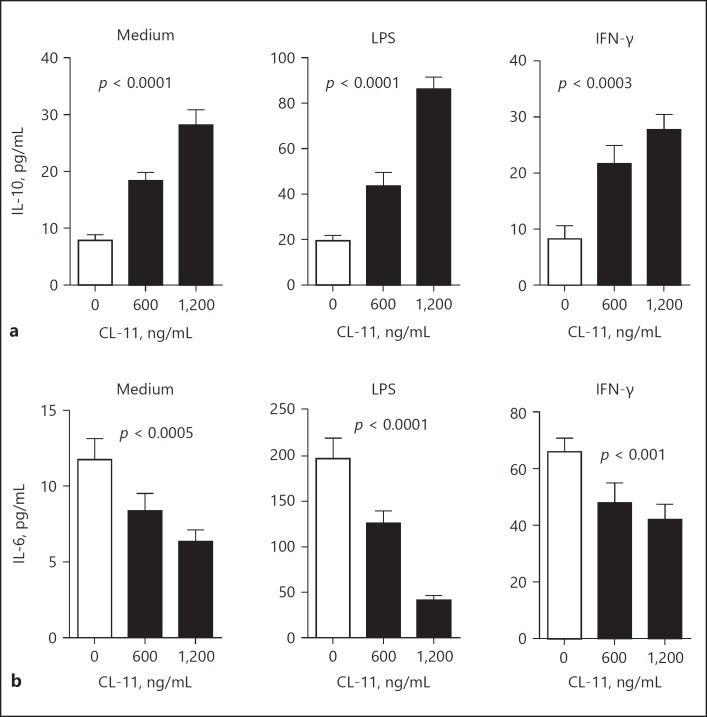
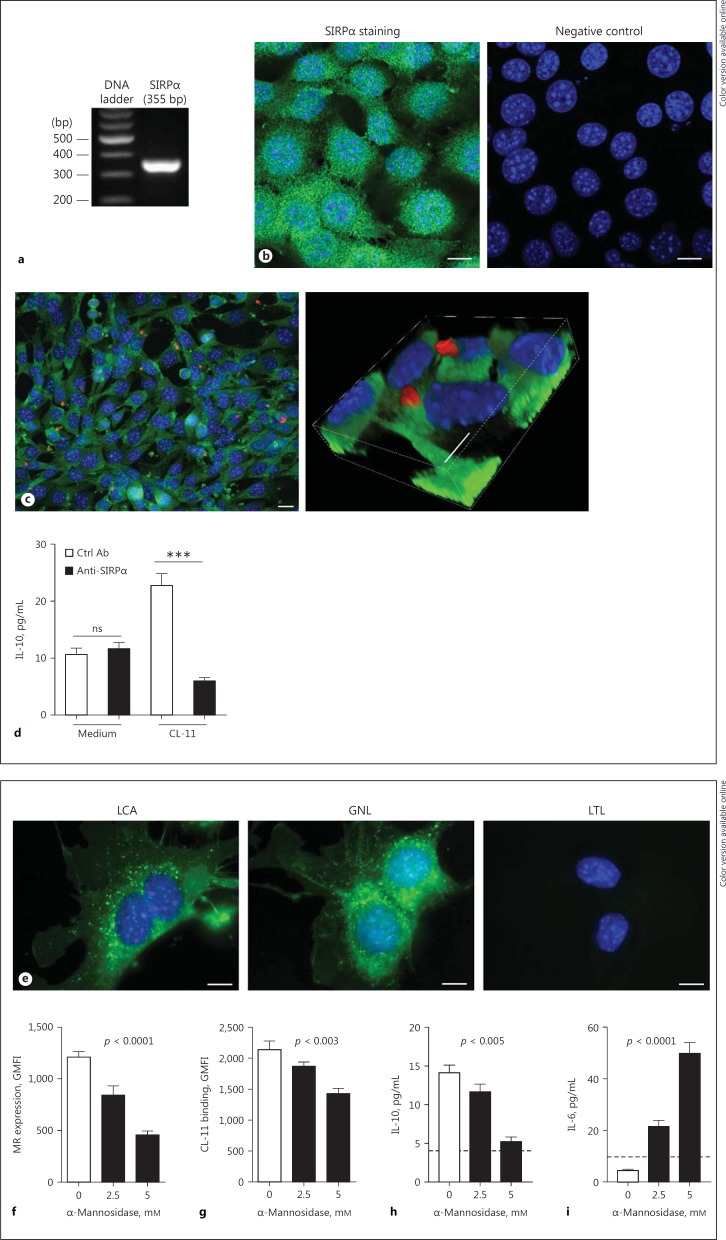
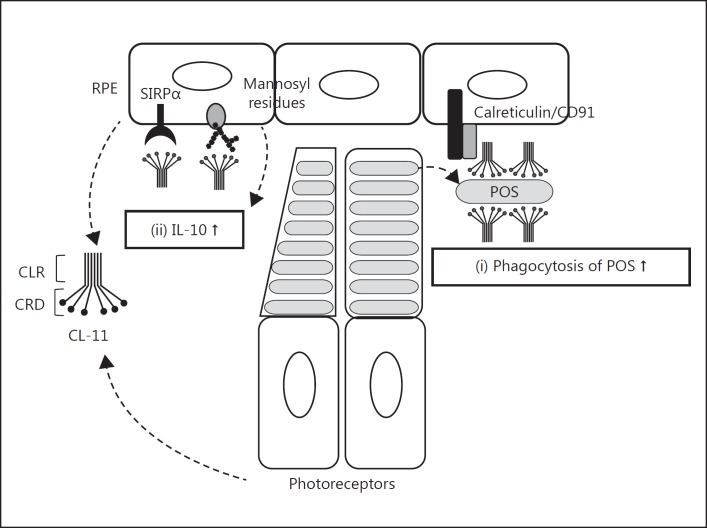
In this paper, we report previously unknown roles for collectin-11 (CL-11, a soluble C-type lectin) in modulating the retinal pigment epithelial (RPE) cell functions of phagocytosis and cytokine production. We found that CL-11 and its carbohydrate ligand are expressed in both the murine and human neural retina; these resemble each other in terms of RPE and photoreceptor cells. Functional analysis of murine RPE cells showed that CL-11 facilitates the opsonophagocytosis of photoreceptor outer segments and apoptotic cells, and also upregulates IL-10 production. Mechanistic analysis revealed that calreticulin on the RPE cells is required for CL-11-mediated opsonophagocytosis whereas signal-regulatory protein α and mannosyl residues on the cells are involved in the CL-11-mediated upregulation of IL-10 production. This study is the first to demonstrate the role of CL-11 and the molecular mechanisms involved in modulating RPE cell phagocytosis and cytokine production. It provides a new insight into retinal health and disease and has implications for other phagocytic cells.

Keywords: CL-K1; Collectin 11; Cytokine production; Opsonophagocytosis; Retinal pigment epithelial cells.


Figures

Fig. 1
Fig. 1
CL-11 is produced in the neural retina and RPE. a RT-PCR on dissected neural retinas (NR) and RPE-choroid complex (RCC) and kidney tissues (used as a positive control) from WT B6 mice. b RT-PCR on mouse primary RPE cells that had been stimulated with (stimulated) or without (unstimulated) TNF-α/IL-1β for 24 h. c Fluorescence microscopy images of immunohistochemical staining of CL-11 (red) in eye tissue of WT and CL-11−/− mice; nuclear marker DAPI (blue) is also shown. Bottom and right: higher-magnification images that correspond with boxed areas. CR, choroid; RPE, retinal pigment epithelium; POS, photoreceptor outer segments; PIS, photoreceptor inner segments; ONL, outer nuclear layer. Scale bar, 20 μm. d Fluorescence microscopy images of immunochemical staining for CL-11 (red) and ZO-1 (a tight junction protein) (green) in flat-mounted RPE-choroid complex of WT and CL-11−/− mice. Scale bar, 10 μm. e Western blot for CL-11 on rCL-11 (used as a positive control) and supernatants of mouse primary RPE cells stimulated with TNF-α/IL-1β for 24 h or were left unstimulated. a–e A representative of 3 experiments is shown.
Fig. 2
Fig. 2
Detection of carbohydrate residue expression in PRC and PRE. a Fluorescence microscopy images of staining with GNL and LCA (green), and DAPI (blue) in the mouse eye. Bottom: higher-magnification images that correspond with the boxed areas. Scale bar, 50 μm. b Fluorescence microscopy images of immunochemical staining for CL-11 (red) and GNL (green) in the mouse eye. Scale bar, 10 μm. A representative of 3 experiments is shown.
Fig. 3
Fig. 3
CL-11 facilitates opsonophagocytosis of POS/apoptotic cells by RPE cells. a Flow cytometry analysis of CL-11 binding to POS incubated with FITC-labeled rCL-11 (600 ng/mL) for 1 h. b Fluorescence microscopy images of primarily cultured mouse RPE incubated with nonopsonized POS (POS) or CL-11 (600 ng/mL) opsonized POS (CL-11-POS) for 1 h, followed by thorough washing and fluorescence quenching; POS were prelabeled with FITC (green), RPE cells were stained with phalloidin (red), nuclear staining was with DAPI (blue). Scale bar, 50 μm. c Quantification of POS associated with RPE cells corresponds to b. Data are from 6 individual images (from 2 coverslips) per group and representative of 3 independent experiments. ** p < 0.01, unpaired two-tailed Student t test. d Confocal images corresponding to the CL-11-POS image in b. The z-stack image shows POS (green) phagocytosed by RPE cells (stained with phalloidin [red]). Scale bar, 25 μm. e Flow cytometry analysis of uptake of POS in B6-RPE07 cells incubated with nonopsonized POS (POS) or CL-11 (600 ng/mL) opsonized POS (CL-11-POS for 2 h, followed by thorough washing and fluorescence quenching. f Quantification of POS associated with RPE cells (histogram e), shown as geometric mean of fluorescence intensity (GMFI). Data are from 4 cell samples per group and were analyzed by unpaired two-tailed Student t test. ** p < 0.01. g Fluorescence microscopy images of B6-RPE07 cells incubated with nonopsonized apoptotic cells (AP) or rCL-11 (600 ng/mL) opsonized apoptotic cells (CL-11-AP) for 1 h, followed by thorough washing and fluorescence quenching; apoptotic cells were prelabeled with TAMRA (red), RPE was stained with phalloidin (green), nuclear staining was with DAPI (blue). Scale bar, 50 μm. h Quantification of apoptotic cells associated with RPE cells corresponds to e. Data shown are from 6 individual images (from 3 coverslips) per group and were analyzed by unpaired two-tailed Student t test. *** p < 0.0001. i Flow cytometry analysis of uptake of AP in B6-RPE07 cells incubated with AP or CL-11-AP (preincubated with indicated concentrations of rCL-11). Apoptotic cells were prelabeled with TAMRA. j Quantification of apoptotic cells associated with RPE cells (histogram i), shown as geometric mean of fluorescence intensity (GMFI). Data are from 4 cell samples per group and were analyzed with one-way ANOVA, comparing the nonopsonized AP with the CL-11-opsonized AP. e–j A representative of 3 independent experiments is shown.
Fig. 4
Fig. 4
CL-11 regulates inflammatory cytokine production by RPE cells. B6-RPE07 cells were cultured with or without rCL-11, in the absence or presence of LPS (10 ng/mL) or IFN-γ (500 U/mL) for 24 h. Supernatants were collected and used for ELISA. a IL-10. b IL-6. Data are from 4 individual cell culture plate wells per group and were analyzed with one-way ANOVA, comparing the untreated and CL-11-treated samples. A representative of 3 independent experiments is shown.
Fig. 5
Fig. 5
Identification of the receptor responsible for CL-11-mediated opsonophagocytosis by RPE cells. a Detection of calreticulin in B6-RPE07 cells by RT-PCR. b Fluorescence microscopy images of B6-RPE07 cells (from 2 independent experiments) stained for calreticulin (green) and the nuclear marker DAPI (blue). Negative control: the staining was performed using 2nd antibody alone. Scale bar, 10 μm. c Confocal images of B6-RPE07 cells (at low and high magnifications) incubated with rCL-11-opsonized POS for 30 min and subjected to staining for CL-11 (red) and calreticulin (green) and the nuclear marker DAPI (blue). Scale bar, 10 μm. A representative of 2 independent experiments is shown. d Flow cytometry analysis of phagocytosis of POS (prelabeled with FITC) by B6-RPE07 cells pretreated with anti-calreticulin antibody or control antibody (Ctrl Ab), and then incubated with nonopsonized POS (POS) or CL-11-opsonized (CL-11-POS) for 2 h. Data are from 4 cell samples per group and were analyzed with one-way ANOVA with the Tukey post hoc test. ** p < 0.01; ns, no significant difference. A representative of 3 independent experiments is shown.
Fig. 6
Fig. 6
Identification of the receptor/molecules involved in CL-11-mediated modulation of cytokine production by RPE cells. a Detection of SIRPα in B6-RPE07 cells by RT-PCR. b Fluorescence microscopy images of B6-RPE07 cells (of 2 independent experiments) stained for SIRPα (green) and nuclear marker DAPI (blue). Negative control: the staining was performed using 2nd antibody alone. Scale bar, 10 μm. c Confocal images of B6-RPE07 cells (at low and high magnifications) incubated with rCL-11 (600 ng/mL) for 1 h and subjected to staining for CL-11 (red) and SIRPα (green) and nuclear marker DAPI (blue). Scale bar, 10 μm. A representative of 2 independent experiments is shown. d B6-RPE07 cells were pretreated with anti-SIPRα antibody (1:100 diluted) or control antibody (Ctrl Ab) and then incubated with or without rCL-11 (600 ng/mL) for 24 h. Supernatants were collected and used for measuring IL-10 by ELISA. Data are from 4 cell samples per group and were analyzed with one-way ANOVA with the Tukey post hoc test. *** p < 0.001; ns, no significance. A representative of 3 independent experiments is shown. e Fluorescence microscopy images of B6-RPE07 cells that had been stained with fluorescence-conjugated GNL, LCA, or LTL (green). Scale bar, 10 μm. f Flow cytometry for the detection of mannosyl residue (MR) expression on B6-RPE07 cells that had been treated with buffer alone or containing α-mannosidase for 2 h, and then stained with fluorescence-conjugated LCA. g Flow cytometry analysis of CL-11 binding to B6-RPE07 cells treated with buffer or containing α-mannosidase for 2 h, incubated with rCL-11 (600 ng/mL) for 1 h, and then subjected to staining for CL-11. h, i B6-RPE07 cells were pretreated with buffer alone or containing α-mannosidase at the indicated concentrations for 2 h and then incubated with rCL-11 (600 ng/mL) for 24 h. Supernatants were collected and used for measuring IL-10 and IL-6 by ELISA. The dashed line indicates the level of IL-10 or IL-6 in RPE cells without CL-11 stimulation. f–i Data are from 4 cell samples per group and were analyzed with one-way ANOVA, comparing the control (buffer alone) and α-mannosidase-treated cells. A representative of 3 independent experiments is shown.
Fig. 7
Fig. 7
A schematic diagram illustrates the proposed mechanisms by which CL-11 modulates RPE cell phagocytosis and cytokine production. Locally produced CL-11 (by RPE, photoreceptors, and possibly other cells): (i) binds to shed POS to mediate or upregulate the phagocytosis of POS through the interaction of the CL-11 collagen-like region (CLR) with calreticulin/CD91 on RPE cells, (ii) binds to RPE cells to mediate the upregulation of IL-10 production through the interaction of the CL-11 carbohydrate domain (CRD) with a specific glycoprotein (SIRPα) and/or mannose-containing structures on RPE cells.

Similar articles

Cited by

References

    1. Strauss O. The retinal pigment epithelium in visual function. Physiol Rev. 2005;85:845–881. - PubMed
    1. Kevany BM, Palczewski K. Phagocytosis of retinal rod and cone photoreceptors. Physiology. 2010;25:8–15. - PMC - PubMed
    1. Young RW, Bok D. Participation of the retinal pigment epithelium in the rod outer segment renewal process. J Cell Biol. 1969;42:392–403. - PMC - PubMed
    1. Keshi H, Sakamoto T, Kawai T, Ohtani K, Katoh T, Jang SJ, Motomura W, Yoshizaki T, Fukuda M, Koyama S, Fukuzawa J, Fukuoh A, Yoshida I, Suzuki Y, Wakamiya N. Identification and characterization of a novel human collectin CL-K1. Microbiol Immunol. 2006;50:1001–1013. - PubMed
    1. Ohtani K, Suzuki Y, Eda S, Kawai T, Kase T, Yamazaki H, Shimada T, Keshi H, Sakai Y, Fukuoh A, Sakamoto T, Wakamiya N. Molecular cloning of a novel human collectin from liver (CL-L1) J Biol Chem. 1999;274:13681–13689. - PubMed