Review
. 2017 Apr 24;10(4):442.
doi: 10.3390/ma10040442.

Crystallization of Polymers Investigated by Temperature-Modulated DSC

Affiliations
Review

Crystallization of Polymers Investigated by Temperature-Modulated DSC

Maria Cristina Righetti. Materials (Basel). .

Abstract

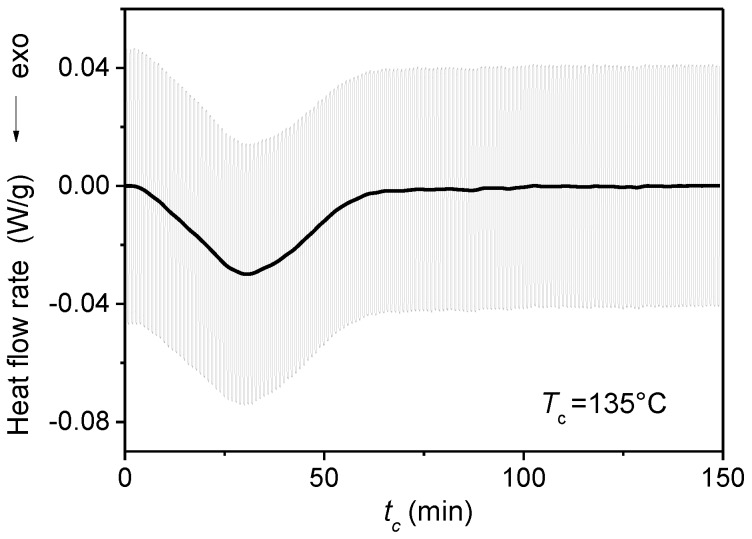
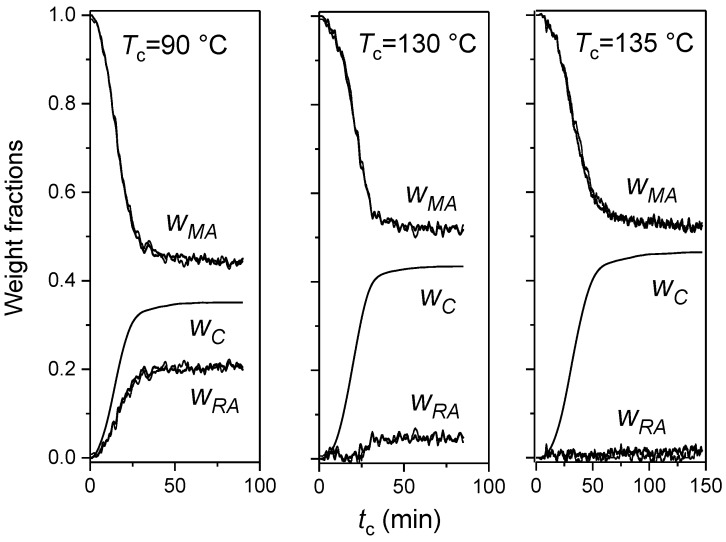
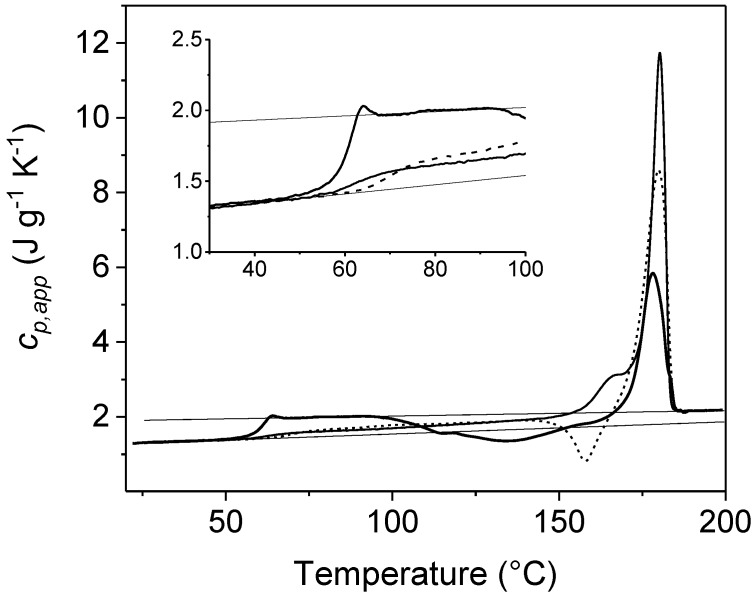
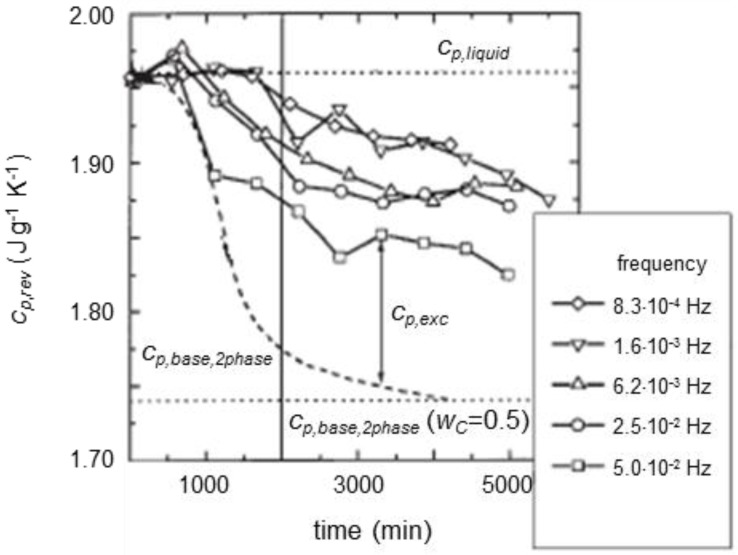
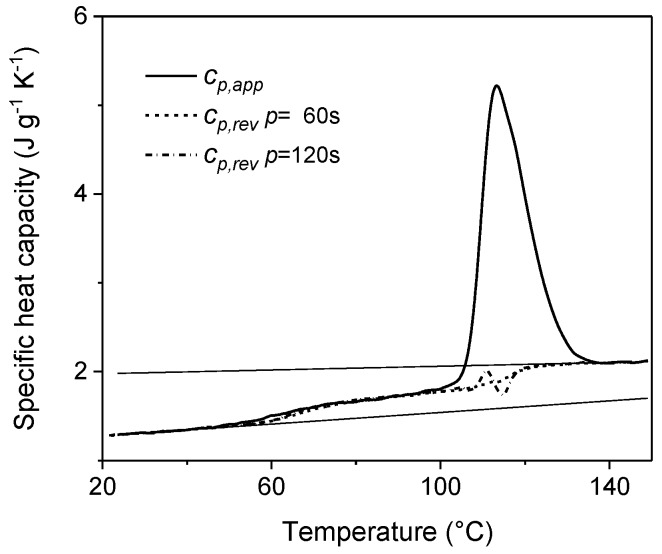
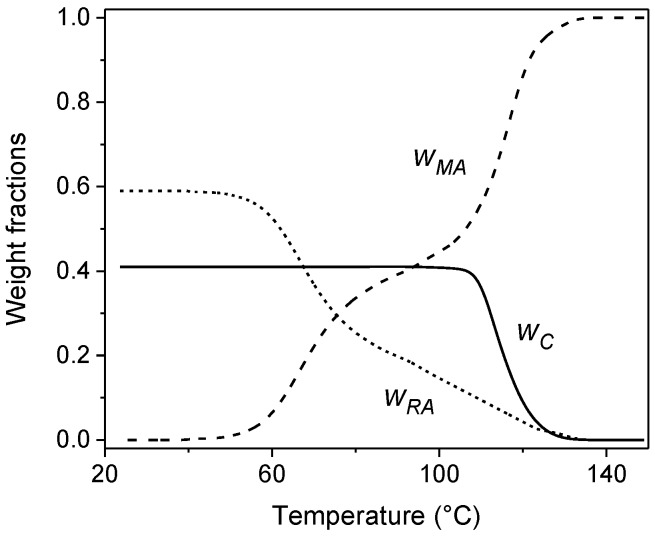
The aim of this review is to summarize studies conducted by temperature-modulated differential scanning calorimetry (TMDSC) on polymer crystallization. This technique can provide several advantages for the analysis of polymers with respect to conventional differential scanning calorimetry. Crystallizations conducted by TMDSC in different experimental conditions are analysed and discussed, in order to illustrate the type of information that can be deduced. Isothermal and non-isothermal crystallizations upon heating and cooling are examined separately, together with the relevant mathematical treatments that allow the evolution of the crystalline, mobile amorphous and rigid amorphous fractions to be determined. The phenomena of 'reversing' and 'reversible' melting are explicated through the analysis of the thermal response of various semi-crystalline polymers to temperature modulation.

Keywords: crystalline fraction; crystallization; differential scanning calorimetry; mobile amorphous fraction; polymer; reversible melting; reversing melting; rigid amorphous fraction; temperature-modulated differential scanning calorimetry.


Conflict of interest statement

The author declares no conflict of interest.

Figures

Figure 1
Figure 1
Apparent specific heat capacity (cp,app) by standard differential scanning calorimetry (DSC) and reversing-specific heat capacity (cp,rev) of poly(3-hydroxybutyrate) (PHB) measured after cooling from the melt at 200 K min−1 at modulation periods p = 60 s and 120 s (AT = 1.0 K, q = 2 K min−1). The thin solid lines are the solid- and liquid-specific heat capacities, as taken from [22]. The inset is an enlargement of the Figure in the cold crystallization region. (Reprinted (adapted) with permission from [35]. Copyright (2012) American Chemical Society).
Figure 2
Figure 2
Reversing-specific heat capacity (cp,rev) of a melt-quenched amorphous poly(ethylene terephthalate) (PET) sample (filled circles) and a melt-crystallized PET sample (open circles) with crystallinity degree of 44%, measured by quasi-isothermal temperature-modulated differential scanning calorimetry (TMDSC) upon stepwise heating (p = 60 s and AT = 1.0 K, oscillation time around each temperature: 20 min). The thin solid lines are the solid and liquid specific heat capacities, as taken from [40]. The broken line is the calculated specific heat capacity for a 40% crystalline PET. (Reprinted (adapted) with permission from [5]. Copyright (1997) American Chemical Society).
Figure 3
Figure 3
Time evolution of reversing specific heat capacity (cp,rev) during quasi-isothermal crystallization of PHB at 23 °C (p = 100 s and AT= 0.4 K), curve a. Curves b and c correspond to the solid and liquid specific heat capacities (cp,solid and cp,liquid), respectively, as taken from [22]. Curve d was estimated from a two-phase model, Equation (3), and curve e from a three-phase model, Equation (5). The squares represent measurements at modulation periods ranging from 240 to 1200 s. Curve f (thick dashed line) is the expected cp,rev curve from model calculations, see text. At the bottom, HF is the average heat flow rate (Reprinted (adapted) with permission from [31]. Copyright (2003) Elsevier).
Figure 4
Figure 4
Crystallization time (tc) evolution of the reversing specific heat capacities (cp,rev) of poly(l-lactic acid) (PLLA) during quasi-isothermal crystallization from the melt at Tc = 90 °C, 130 °C, and 135 °C, respectively (p = 60 s: thick line, p = 120 s: thin line, AT = 0.4 K). (Reprinted (adapted) with permission from [34]. Copyright (2011) Elsevier).
Figure 5
Figure 5
Crystallization time (tc) evolution of the modulated heat flow rate (HFmod: grey line) and average heat flow rate (HF: black line) during quasi-isothermal crystallization of PLLA (p = 60 s, AT = 0.4 K) at Tc = 135 °C. (Reprinted (adapted) with permission from [34]. Copyright (2011) Elsevier).
Figure 6
Figure 6
Time evolution of crystalline (wC), mobile amorphous (wMA) and rigid amorphous (wRA) weight fractions during quasi-isothermal crystallization from the melt of PLLA at Tc = 90 °C, 130 °C, and 135 °C (p = 60 s: thick line, p = 120 s: thin line, AT = 0.4 K). Estimated errors: ±0.02 for wC and wMA, ±0.04 for wRA. (Reprinted (adapted) with permission from [34]. Copyright (2011) Elsevier).
Figure 7
Figure 7
Apparent specific heat capacity (cp,app) of an amorphous PLLA sample (thickest solid line) and after complete isothermal crystallization at Tc = 85 °C (dotted line) and Tc = 145 °C (solid line) (heating rate 10 K min−1). The thin solid lines are the solid and liquid thermodynamic specific heat capacities, as taken from the literature [45]. The inset is an enlargement of the Tg region. (Reprinted (adapted) with permission from [46]. Copyright (2015) Elsevier).
Figure 8
Figure 8
Reversing-specific heat capacity (cp,rev) during crystallization of PCL at 55 °C as a function of crystallization time (AT = 0.5 K). cp,base,2phase was calculated according to Equation (3). (Reprinted (adapted) with permission from [7]. Copyright (2000) Springer).
Figure 9
Figure 9
Excess specific heat capacity of PCL (cp,exc) after 2000 min of crystallization at 55 °C as a function of the modulation frequency. (Reprinted (adapted) with permission from [7]. Copyright (2000) Springer).
Figure 10
Figure 10
(A) Reversing specific heat capacity (cp,rev) of a linear polyethylene (PE) during quasi-isothermal crystallization at 126 °C (solid line). A sinusoidal temperature modulation was applied with AT = 1.0 K and p = 60 s. The linear solid line is the liquid thermodynamic specific heat capacity of PE at 126 °C [63]. The cp,base curve (dotted line) was calculated according to Equation (3), on the basis of the variation of the crystalline weight fraction (wC) with time. At the bottom, HF (dashed line) is the average heat flow rate. (B) Time evolution of the crystalline weight fraction (wC), calculated as the ratio between the integrated average heat flow rate (HF) and the literature value for the heat of fusion of 100% crystalline polyethylene [63]. (Reprinted (adapted) with permission from [8]. Copyright (2001) American Chemical Society).
Figure 11
Figure 11
The effect of the modulation amplitude on the quasi-isothermal crystallization of linear PE at 128.5 °C: top: reversing-specific heat capacities (cp,rev) curves, bottom: average heat flow rate (HF) curves. (Reprinted (adapted) with permission from [26]. Copyright (1999) Elsevier).
Figure 12
Figure 12
Evolution of the excess specific heat capacity (cp,exc) with time during quasi-isothermal crystallization of a linear PE at the indicated temperatures (AT = 0.8 K and p = 48 s). (Reprinted (adapted) with permission from [60]. Copyright (2004) American Chemical Society).
Figure 13
Figure 13
Correspondence between the three stages of the melting temperature (Tm) evolution, plotted as the difference between the melting temperature and the crystallization temperature (Tc), and the decay of the excess heat capacity at the indicated crystallization temperature. (Reprinted (adapted) with permission from [60]. Copyright (2004) American Chemical Society).
Figure 14
Figure 14
Time dependence of the reversing specific heat capacity (cp,rev) of PBT isothermally crystallized at 200 °C for 30 min, during quasi-isothermal measurements over long time periods in the melting region at To = 216.5 °C (□) and 225.2 °C (○) (p = 120 s, AT = 0.2 K). The dashed lines with squares and circles are the cp,base,2phase values calculated by Equation (3) from the crystallinity degrees measured at the end of the quasi-isothermal annealing at To = 216.5 °C and 225.2 °C, respectively, by using the solid and liquid specific heat capacities of PBT as taken from [40]. (Reprinted (adapted) with permission from [73]. Copyright (2004) American Chemical Society).
Figure 15
Figure 15
(A) Apparent specific heat capacity (cp,app, dashed line) and reversing specific heat capacity (cp,rev, solid line) of PBT isothermally crystallized at 200 °C for 30 min as a function of temperature during heating (heating rate: 0.5 K min−1, modulation period: 120 s, temperature modulation amplitude: 0.2 K); (B) time dependence of the reversing specific heat capacity (cp,rev) of PBT during quasi-isothermal measurements of 6 h at the indicted Tos. The data are from separate measurements and are collected in a single graph in order to compare the cp,rev trend at different temperatures. The dashed lines are the cp,base,2phase values calculated by Equation (3) from the values of the crystallinity degrees measured at the end of the quasi-isothermal annealing, by using the solid and liquid specific heat capacities of PBT as taken from [40]. (Reprinted (adapted) with permission from [73]. Copyright (2004) American Chemical Society).
Figure 16
Figure 16
Apparent specific heat capacity (cp,app) by standard DSC and reversing specific heat capacity (cp,rev) of PET at modulation period of 60 s and 120 s, measured upon cooling from the melt at 2 K min−1 (AT = 1.0 K). The black solid line with circles is the approximate linear baseline, whereas the solid grey line is the two-phase baseline (cp,base,2phase). The black thin solid lines are the solid and liquid specific heat capacities of PET, as taken from [40]. The inset shows the entire cp,app curve. (Reprinted (adapted) with permission from [37]. Copyright (2014) Elsevier).
Figure 17
Figure 17
Temperature evolution of the crystalline weight fraction (wC) of PET during non-isothermal crystallization at 2 K min−1. (Reprinted (adapted) with permission from [37]. Copyright (2014) Elsevier).
Figure 18
Figure 18
Reversing-specific heat capacity (cp,rev) of PET (filled circles) during stepwise quasi-isothermal TMDSC cooling from the melt (p = 60 s and AT = 1.0 K, oscillation time around each temperature: 20 min). The thin solid lines are the solid and liquid specific heat capacities, as taken from [40]. The broken line is the calculated specific heat capacity for a 49% crystalline PET. The open circles describe the cp,rev curve of a melt-crystallized PET sample (crystallinity degree: 44%). (Reprinted (adapted) with permission from [5]. Copyright (1997) American Chemical Society).
Figure 19
Figure 19
Apparent specific heat capacity (cp,app: solid lines) of PLLA and reversing specific heat capacity (cp,rev) on cooling at 2 K min−1 as a function of temperature (p = 60 s: dashed line; p = 120 s: dashed dotted line). The thin solid lines are the thermodynamic solid and liquid specific heat capacities of PLLA as taken from the literature [45]. (Reprinted (adapted) with permission from [79]. Copyright (2017) Springer).
Figure 20
Figure 20
Temperature evolution of the mobile amorphous (wMA: dashed line), crystalline (wC: solid line), and rigid amorphous (wRA: dotted line) weight fractions during non-isothermal crystallization of PLLA at 2 K min−1. Estimated errors: ±0.02 for wC and wMA, ±0.04 for wRA. (Reprinted (adapted) with permission from [79]. Copyright (2017) Springer).

References

    1. Schick C. Temperature modulated differential scanning calorimetry (TMDSC—Basics and applications to polymers. In: Cheng S.Z.D., editor. Handbook of Thermal Analysis and Calorimetry. Volume 3. Elsevier Science B.V.; Amsterdam, The Netherlands: 2002. pp. 713–810.
    1. Wunderlich B. Reversible crystallization and the rigid-amorphous phase in semicrystalline polymers. Prog. Polym. Sci. 2003;28:383–450. doi: 10.1016/S0079-6700(02)00085-0. - DOI
    1. Gill P.S., Sauerbrunn S.R., Reading M. Modulated differential scanning calorimetry. J. Therm. Anal. 1993;40:931–939. doi: 10.1007/BF02546852. - DOI
    1. Okazaki I., Wunderlich B. Reversible local melting in polymer crystals. Macromol. Rapid Commun. 1997;18:313–318. doi: 10.1002/marc.1997.030180407. - DOI
    1. Okazaki I., Wunderlich B. Reversible melting in polymer crystals detected by temperature-modulated differential scanning calorimetry. Macromolecules. 1997;30:1758–1764. doi: 10.1021/ma961539d. - DOI

LinkOut - more resources