

Solid-State Method Synthesis of SnO₂-Decorated g-C₃N₄ Nanocomposites with Enhanced Gas-Sensing Property to Ethanol
- PMID: 28772960
- PMCID: PMC5553421
- DOI: 10.3390/ma10060604
Solid-State Method Synthesis of SnO₂-Decorated g-C₃N₄ Nanocomposites with Enhanced Gas-Sensing Property to Ethanol
Abstract
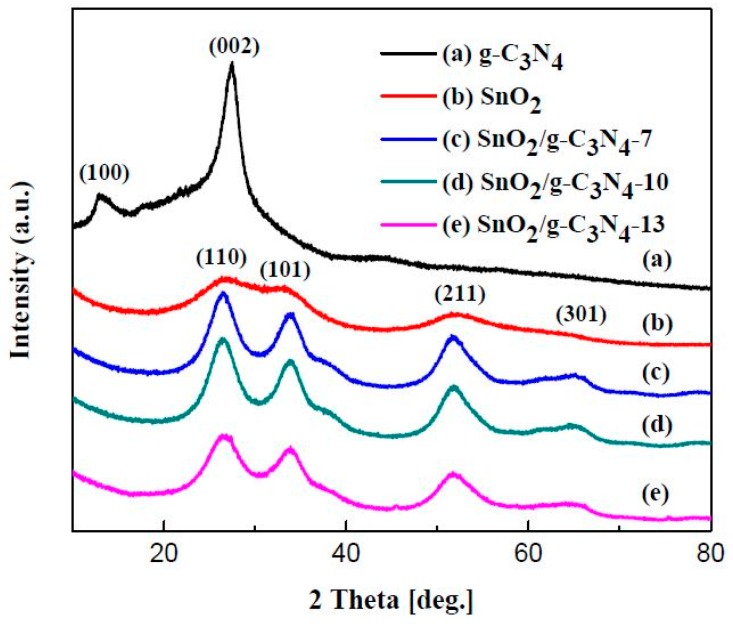
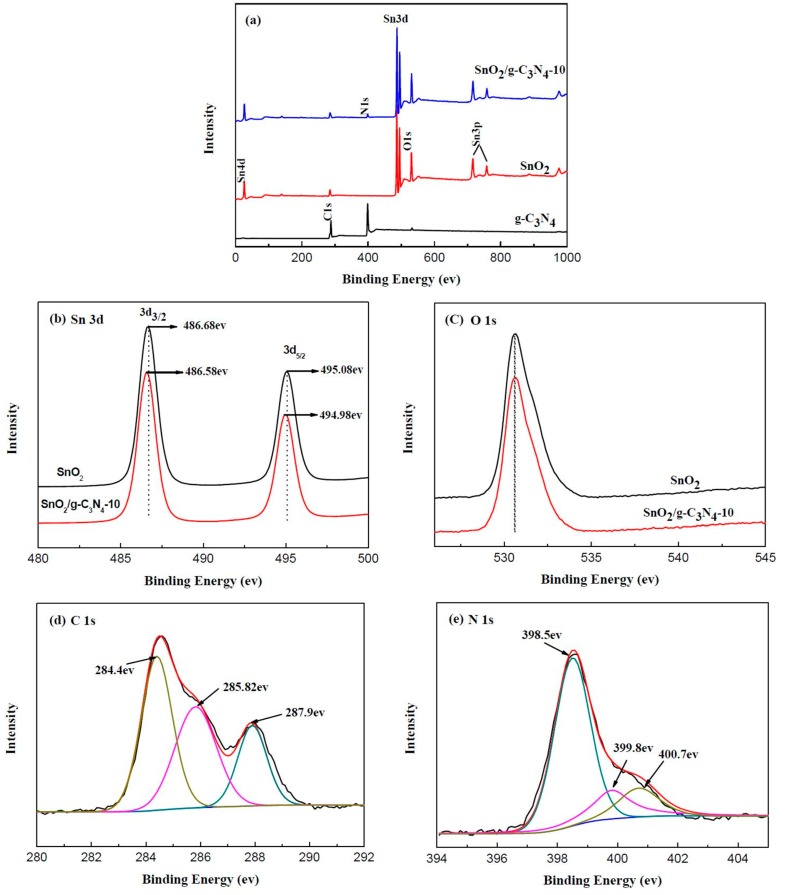
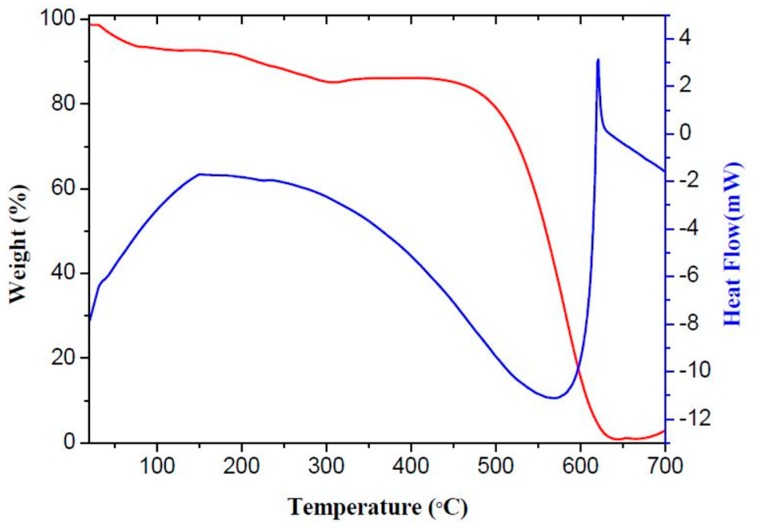
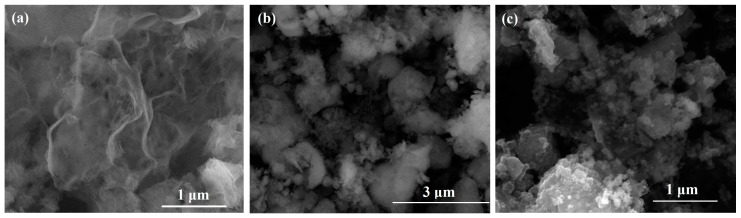
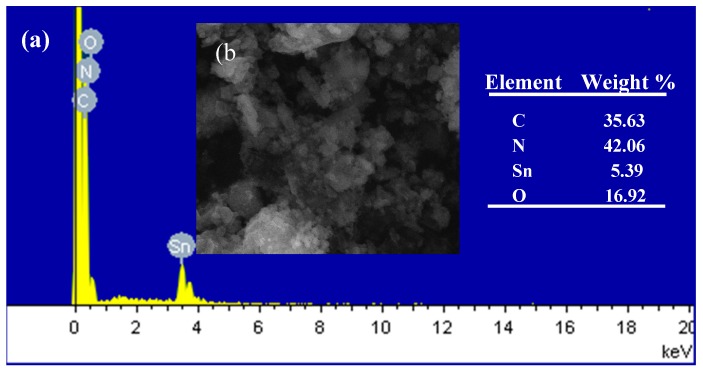
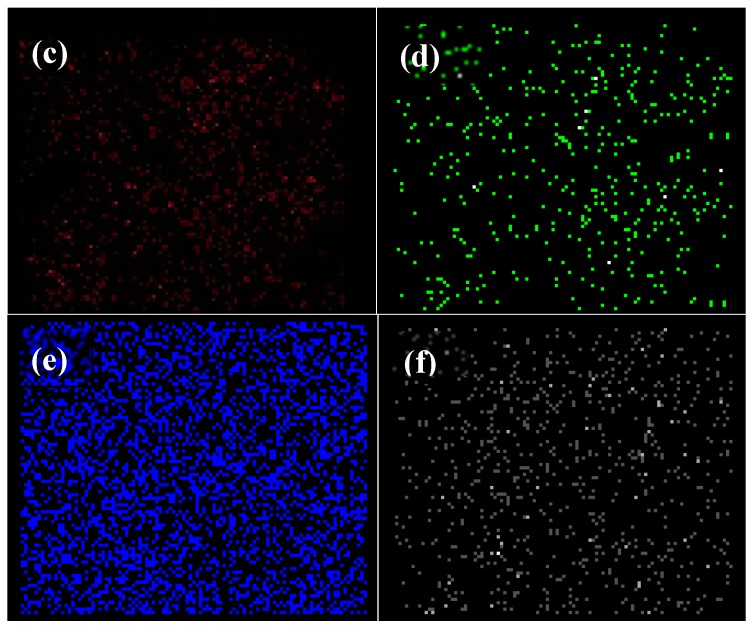
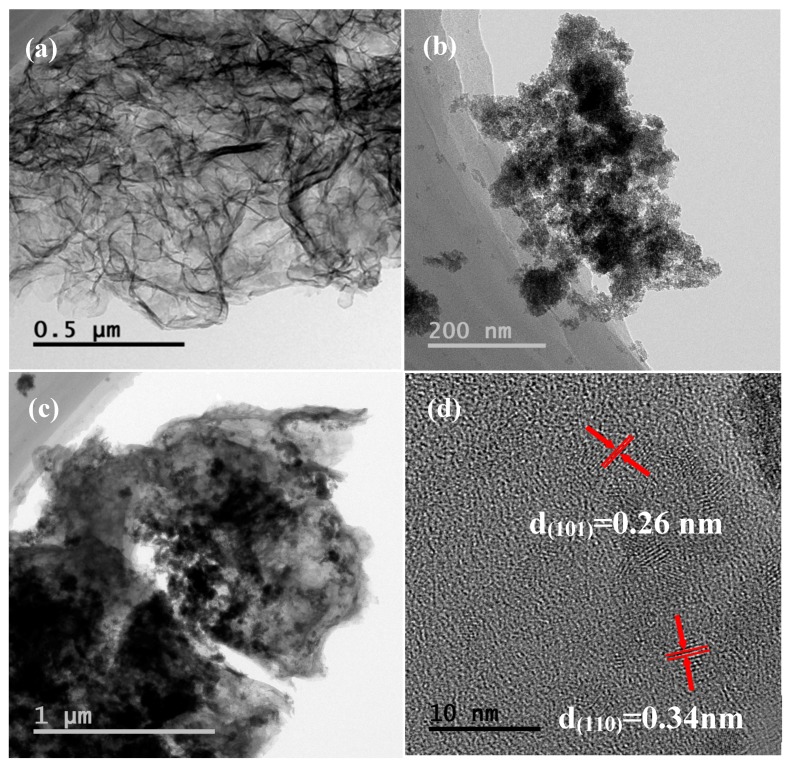
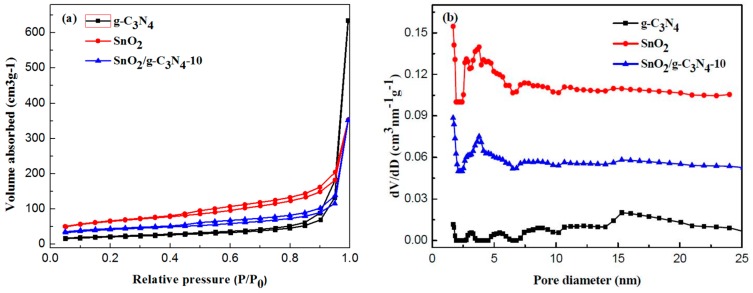
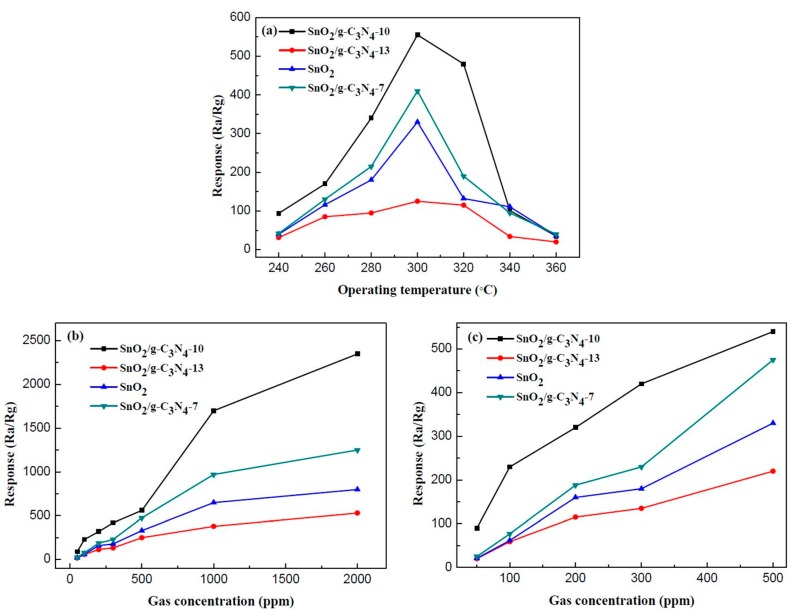
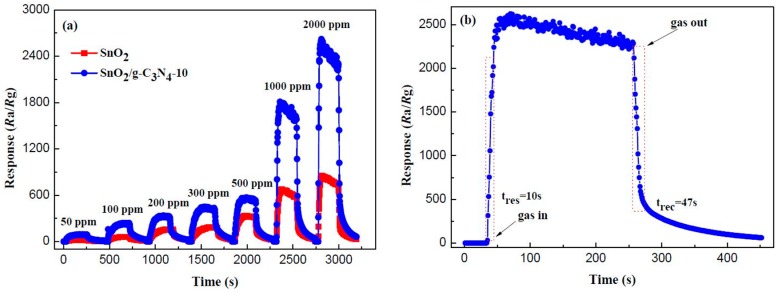
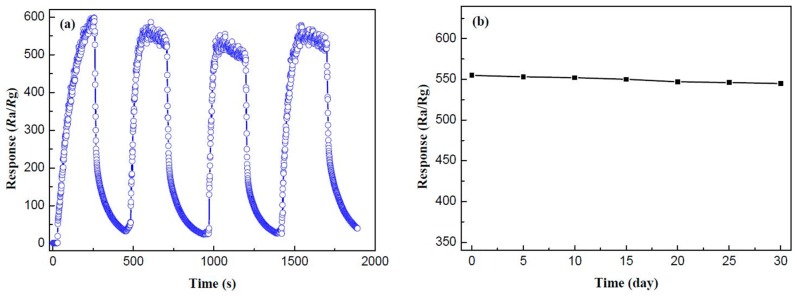
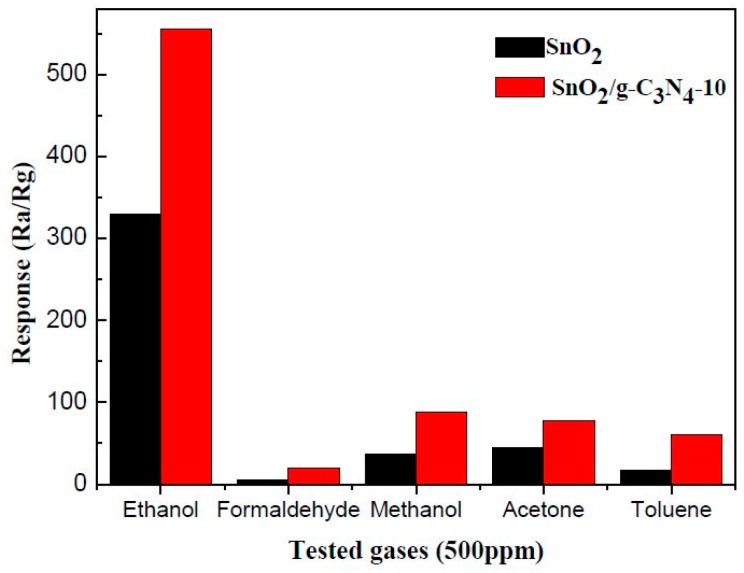
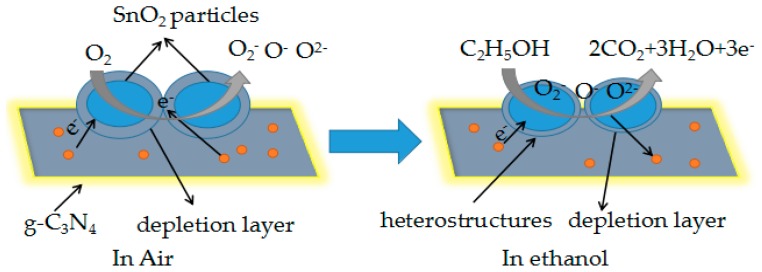
SnO₂/graphitic carbon nitride (g-C₃N₄) composites were synthesized via a facile solid-state method by using SnCl₄·5H₂O and urea as the precursor. The structure and morphology of the as-synthesized composites were characterized by the techniques of X-ray diffraction (XRD), field-emission scanning electron microscopy (FESEM), transmission electron microscopy (TEM), energy dispersive spectrometer (EDS), thermogravimetry-differential thermal analysis (TG-DTA), X-ray photoelectron spectroscopy (XPS), and N₂ sorption. The results indicated that the composites possessed a two-dimensional (2-D) structure, and the SnO₂ nanoparticles were highly dispersed on the surface of the g-C₃N₄ nanosheets. The gas-sensing performance of the samples to ethanol was tested, and the SnO₂/g-C₃N₄ nanocomposite-based sensor exhibited admirable properties. The response value (Ra/Rg) of the SnO₂/g-C₃N₄ nanocomposite with 10 wt % 2-D g-C₃N₄ content-based sensor to 500 ppm of ethanol was 550 at 300 °C. However, the response value of pure SnO₂ was only 320. The high surface area of SnO₂/g-C₃N₄-10 (140 m²·g-1) and the interaction between 2-D g-C₃N₄ and SnO₂ could strongly affect the gas-sensing property.
Keywords: 2-D graphitic carbon nitride; SnO2; ethanol; gas-sensing performance; nanocomposite.
Conflict of interest statement
The authors declare no conflict of interest.
Figures
Similar articles
-
Calcination Method Synthesis of SnO2/g-C3N4 Composites for a High-Performance Ethanol Gas Sensing Application.Nanomaterials (Basel). 2017 Apr 29;7(5):98. doi: 10.3390/nano7050098. Nanomaterials (Basel). 2017. PMID: 28468245 Free PMC article.
-
Synthesis and Enhanced Ethanol Gas Sensing Properties of the g-C₃N₄ Nanosheets-Decorated Tin Oxide Flower-Like Nanorods Composite.Nanomaterials (Basel). 2017 Sep 22;7(10):285. doi: 10.3390/nano7100285. Nanomaterials (Basel). 2017. PMID: 28937649 Free PMC article.
-
Highly Sensitive Acetone Gas Sensor Based on g-C₃N₄ Decorated MgFe₂O₄ Porous Microspheres Composites.Sensors (Basel). 2018 Jul 10;18(7):2211. doi: 10.3390/s18072211. Sensors (Basel). 2018. PMID: 29996480 Free PMC article.
-
Improving methane gas sensing performance of flower-like SnO2 decorated by WO3 nanoplates.Talanta. 2019 Jul 1;199:603-611. doi: 10.1016/j.talanta.2019.03.014. Epub 2019 Mar 2. Talanta. 2019. PMID: 30952304
-
Graphitic carbon nitride nanosheets as promising candidates for the detection of hazardous contaminants of environmental and biological concern in aqueous matrices.Mikrochim Acta. 2022 Oct 19;189(11):426. doi: 10.1007/s00604-022-05516-x. Mikrochim Acta. 2022. PMID: 36260130 Review.
Cited by
-
Aqueous solution photocatalytic synthesis of p-anisaldehyde by using graphite-like carbon nitride photocatalysts obtained via the hard-templating route.RSC Adv. 2020 May 21;10(33):19431-19442. doi: 10.1039/d0ra02746d. eCollection 2020 May 20. RSC Adv. 2020. PMID: 35515447 Free PMC article.
-
Graphitic Carbon Nitride-Wrapped Metal-free PoPD-Based Biosensor for Xanthine Detection.ACS Omega. 2022 Dec 30;8(2):2328-2336. doi: 10.1021/acsomega.2c06727. eCollection 2023 Jan 17. ACS Omega. 2022. PMID: 36687095 Free PMC article.
-
Sugarcane juice derived carbon dot-graphitic carbon nitride composites for bisphenol A degradation under sunlight irradiation.Beilstein J Nanotechnol. 2018 Jan 30;9:353-363. doi: 10.3762/bjnano.9.35. eCollection 2018. Beilstein J Nanotechnol. 2018. PMID: 29515949 Free PMC article.
-
Metal Oxide Heterostructures for Improving Gas Sensing Properties: A Review.Materials (Basel). 2022 Dec 27;16(1):263. doi: 10.3390/ma16010263. Materials (Basel). 2022. PMID: 36614603 Free PMC article. Review.
-
Effect of the Functionalization of Porous Silicon/WO₃ Nanorods with Pd Nanoparticles and Their Enhanced NO₂-Sensing Performance at Room Temperature.Materials (Basel). 2018 May 10;11(5):764. doi: 10.3390/ma11050764. Materials (Basel). 2018. PMID: 29748458 Free PMC article.
References
-
- Hou C., Li J., Huo D., Luo X., Dong J., Yang M., Shi X. A portable embedded toxic gas detection device based on a cross-responsive sensor array. Sens. Actuators B Chem. 2012;161:244–250. doi: 10.1016/j.snb.2011.10.026. - DOI
-
- Ariyageadsakul P., Vchirawongkwin V., Kritayakornupong C. Determination of toxic carbonyl species including acetone, formaldehyde, and phosgene by polyaniline emeraldine gas sensor using DFT calculation. Sens. Actuators B Chem. 2016;232:165–174. doi: 10.1016/j.snb.2016.03.137. - DOI
LinkOut - more resources
Full Text Sources
Other Literature Sources
Miscellaneous
