

Imaging Water Thin Films in Ambient Conditions Using Atomic Force Microscopy
- PMID: 28773306
- PMCID: PMC5456730
- DOI: 10.3390/ma9030182
Imaging Water Thin Films in Ambient Conditions Using Atomic Force Microscopy
Abstract
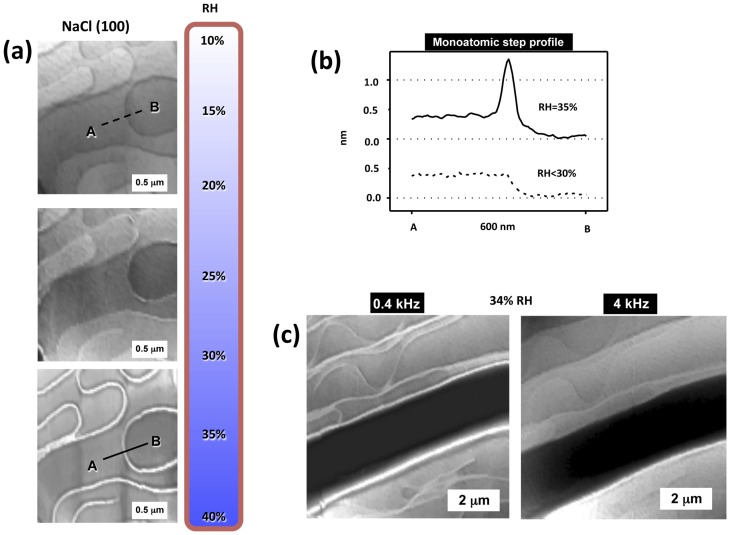
All surfaces exposed to ambient conditions are covered by a thin film of water. Other than at high humidity conditions, i.e., relative humidity higher than 80%, those water films have nanoscale thickness. Nevertheless, even the thinnest film can profoundly affect the physical and chemical properties of the substrate. Information on the structure of these water films can be obtained from spectroscopic techniques based on photons, but these usually have poor lateral resolution. When information with nanometer resolution in the three dimensions is needed, for example for surfaces showing heterogeneity in water affinity at the nanoscale, Atomic Force Microscopy (AFM) is the preferred tool since it can provide such resolution while being operated in ambient conditions. A complication in the interpretation of the data arises when using AFM, however, since, in most cases, direct interaction between a solid probe and a solid surface occurs. This induces strong perturbations of the liquid by the probe that should be controlled or avoided. The aim of this review is to provide an overview of different AFM methods developed to overcome this problem, measuring different interactions between the AFM probe and the water films, and to discuss the type of information about the water film that can be obtained from these interactions.
Keywords: adsorption; atomic force microscopy; thin films; water.
Conflict of interest statement
The authors declare no conflict of interest
Figures


Similar articles
-
Ambient atomic resolution atomic force microscopy with qPlus sensors: Part 1.Microsc Res Tech. 2017 Jan;80(1):50-65. doi: 10.1002/jemt.22730. Epub 2016 Jul 30. Microsc Res Tech. 2017. PMID: 27474417 Review.
-
Effect of water on the surface molecular mobility of poly(lactide) thin films: an atomic force microscopy study.Biomacromolecules. 2004 Jul-Aug;5(4):1187-93. doi: 10.1021/bm0345007. Biomacromolecules. 2004. PMID: 15244429
-
Studying the Adhesion Force and Glass Transition of Thin Polystyrene Films by Atomic Force Microscopy.Nanoscale Res Lett. 2018 Jan 9;13(1):5. doi: 10.1186/s11671-017-2426-9. Nanoscale Res Lett. 2018. PMID: 29318399 Free PMC article.
-
Mechanical characterization of polymeric thin films by atomic force microscopy based techniques.Anal Bioanal Chem. 2013 Feb;405(5):1463-78. doi: 10.1007/s00216-012-6419-3. Epub 2012 Oct 4. Anal Bioanal Chem. 2013. PMID: 23052864 Review.
-
Preliminary indications from atomic force microscopy of the presence of rapidly-formed nanoscale films on aquifer material surfaces.J Contam Hydrol. 2009 Aug 11;108(1-2):46-53. doi: 10.1016/j.jconhyd.2009.05.006. Epub 2009 May 19. J Contam Hydrol. 2009. PMID: 19589614
Cited by
-
Direct observation of anisotropic growth of water films on minerals driven by defects and surface tension.Sci Adv. 2020 Jul 24;6(30):eaaz9708. doi: 10.1126/sciadv.aaz9708. eCollection 2020 Jul. Sci Adv. 2020. PMID: 32832658 Free PMC article.
-
Water Adsorption on Mica Surfaces with Hydrophilicity Tuned by Counterion Types (Na, K, and Cs) and Structural Fluorination.J Phys Chem C Nanomater Interfaces. 2022 Sep 20;126(38):16447-16460. doi: 10.1021/acs.jpcc.2c04751. eCollection 2022 Sep 29. J Phys Chem C Nanomater Interfaces. 2022. PMID: 37881644 Free PMC article.
-
Imaging in Biologically-Relevant Environments with AFM Using Stiff qPlus Sensors.Sci Rep. 2018 Jun 19;8(1):9330. doi: 10.1038/s41598-018-27608-6. Sci Rep. 2018. PMID: 29921947 Free PMC article.
-
Studying Ice with Environmental Scanning Electron Microscopy.Molecules. 2021 Dec 31;27(1):258. doi: 10.3390/molecules27010258. Molecules. 2021. PMID: 35011490 Free PMC article. Review.
-
Electrostatic force microscopy for the accurate characterization of interphases in nanocomposites.Beilstein J Nanotechnol. 2018 Dec 7;9:2999-3012. doi: 10.3762/bjnano.9.279. eCollection 2018. Beilstein J Nanotechnol. 2018. PMID: 30591848 Free PMC article.
References
-
- Henderson M.A. The interaction of water with solid surfaces: Fundamental aspects revisited. Surf. Sci. Rep. 2002;46:1–308. doi: 10.1016/S0167-5729(01)00020-6. - DOI
-
- Israelachvili J.N. Intermolecular and Surface Forces. 3rd ed. Academic Press; Burlington, MA, USA: 2011.
-
- Bhushan B., Israelachvili J.N., Landman U. Nanotribology—Friction, wear and lubrication at the atomic-scale. Nature. 1995;374:607–616. doi: 10.1038/374607a0. - DOI
Publication types
LinkOut - more resources
Full Text Sources
Other Literature Sources
Miscellaneous
