Review
. 2016 May 24;9(6):406.
doi: 10.3390/ma9060406.

Graphene-Gold Nanoparticles Hybrid-Synthesis, Functionalization, and Application in a Electrochemical and Surface-Enhanced Raman Scattering Biosensor

Affiliations
Review

Graphene-Gold Nanoparticles Hybrid-Synthesis, Functionalization, and Application in a Electrochemical and Surface-Enhanced Raman Scattering Biosensor

Ibrahim Khalil et al. Materials (Basel). .

Abstract

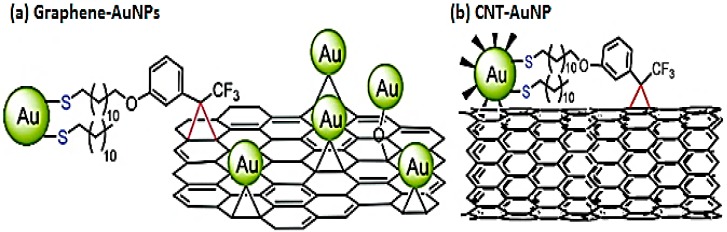
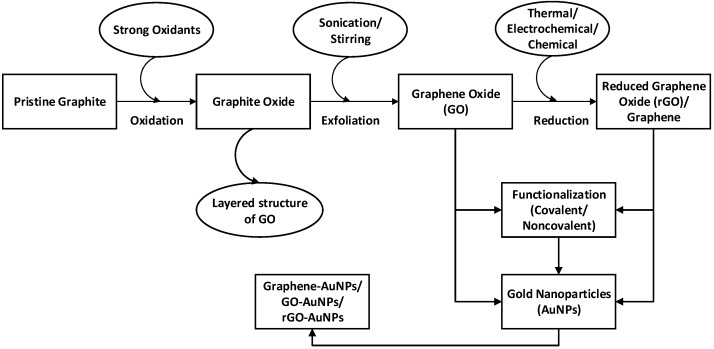
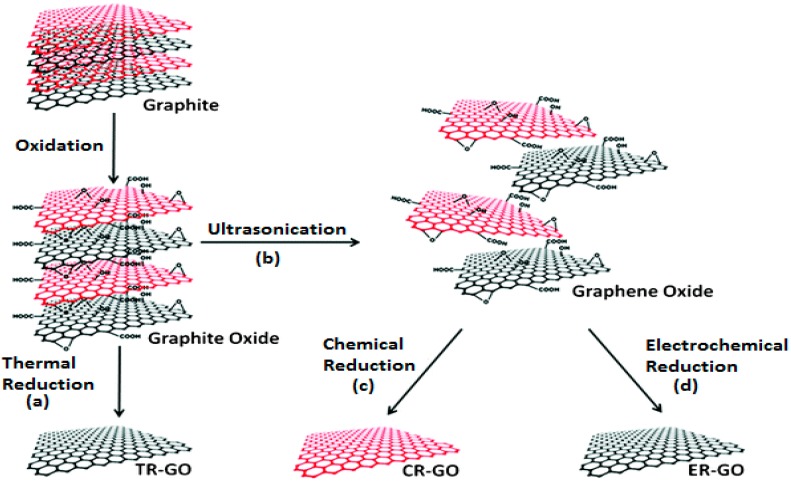
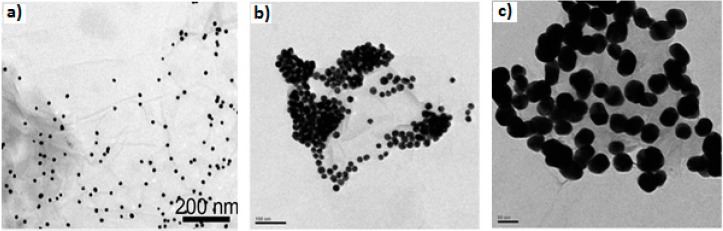
Graphene is a single-atom-thick two-dimensional carbon nanosheet with outstanding chemical, electrical, material, optical, and physical properties due to its large surface area, high electron mobility, thermal conductivity, and stability. These extraordinary features of graphene make it a key component for different applications in the biosensing and imaging arena. However, the use of graphene alone is correlated with certain limitations, such as irreversible self-agglomerations, less colloidal stability, poor reliability/repeatability, and non-specificity. The addition of gold nanostructures (AuNS) with graphene produces the graphene-AuNS hybrid nanocomposite which minimizes the limitations as well as providing additional synergistic properties, that is, higher effective surface area, catalytic activity, electrical conductivity, water solubility, and biocompatibility. This review focuses on the fundamental features of graphene, the multidimensional synthesis, and multipurpose applications of graphene-Au nanocomposites. The paper highlights the graphene-gold nanoparticle (AuNP) as the platform substrate for the fabrication of electrochemical and surface-enhanced Raman scattering (SERS)-based biosensors in diverse applications as well as SERS-directed bio-imaging, which is considered as an emerging sector for monitoring stem cell differentiation, and detection and treatment of cancer.

Keywords: SERS biosensor; bioimaging; electrochemical biosensor; graphene; graphene–gold nanoparticle.


Conflict of interest statement

The authors declare no conflict of interest.

Figures

Figure 1
Figure 1
(a) Decoration of AuNPs on graphene. Adapted from [23], with permission from ©2011 American Chemical Society; (b) Covalent attachment of AuNP on CNT. Adapted from [24], with permission from ©2011 American Chemical Society.
Figure 2
Figure 2
Schematic representation of the formation of graphene–AuNPs nanocomposites.
Figure 3
Figure 3
Schematic representation of the synthesis of chemically modified graphene. Adapted from [63], with permission from ©2012 Royal Society of Chemistry.
Figure 4
Figure 4
TEM image of GO–AuNPs composites (a) in situ growth, adapted from [81], with permission from ©2014 Nature Publishing Groupand (b) and (c) ex situ decoration of 20 nm and 40 nm AuNPs on GO sheets respectively, adapted from [82], with permission from ©2010 Royal Society of Chemistry.
Figure 5
Figure 5
Schematic diagram of the graphene–AuNPs synthesis procedures.
Figure 6
Figure 6
Ex situ Graphene-–AuNPs decoration (a) noncovalent interactions, adapted from [132], with permission from ©2009 Royal Society of Chemistry; (b) LBL self-assembly, adapted from [118], with permission from ©2012 American Chemical Society.
Figure 7
Figure 7
TEM images of the Au-encapsulated GO nanoparticles at (a) low magnification; (b) high magnification, adapted from [140], with permission from ©2013 Royal Society of Chemistry and (c) SEM image of GO-wrapped AuNPs, adapted from [141], with permission from ©2014, 2015 Wiley.
Figure 8
Figure 8
LBL fabrication process of Au@PLA–(PAH/GO)n microcapsule. Adapted from [148], with permission from ©2013 Elsevier.
Figure 9
Figure 9
Fabrication steps of AuNPs–Graphene/Hb/Nafion/GC electrode and electrocatalytic activity for H2O2. Adapted from [87], with permission from ©2014 Elsevier.
Figure 10
Figure 10
Schematic representation of the fabrication procedure of the DNA biosensor. (a) DPV cures from the super-sandwich biosensor; (b) DPV cures from the sandwich biosensor. Adapted from [167], with permission from ©2015 Elsevier.
Figure 11
Figure 11
Fabrication of eGr–AuNP on ITO for immune sensing of estradiol. Adapted from [120], with permission from ©2013 Elsevier.
Figure 12
Figure 12
Morphology-dependent SERS performance of normal SERS and graphene-mediated SERS (G-SERS). (a,d) AFM images of a bilayer graphene (2LG)-covered 8-nm gold film (a) before, and (d) after annealing, showing both the bare gold regions and graphene-covered regions; (b,e) Schematic illustration of the contact state between graphene and AuNS correspond to the enlarged regions; (c,f) SERS performance of normal SERS (top) and G-SERS regions (bottom) (c) before, and (f) after annealing, respectively. “*” marks the G and G′ band of the 2LG. The figure is adapted from [198], with permission from ©2013 Wiley.
Figure 13
Figure 13
In the upper (a) GO/PVP/IGAuNPs and (b) IGAuNPs—SERS spectra of A549 cells collected from the regions corresponding to the cytoplasm, nucleoplasm, and nucleolus. In the lower—typical SERS images of A549 cells contained with (a) IGAuNPs or (b) GO/PVP/IGAuNPs, showing the distribution of gold nanostructures inside the cell. The dotted lines in the images are drawn to indicate the boundaries of select cells. Adapted from [220], with permission from ©2012 American Chemical Society.
Figure 14
Figure 14
Schematic diagram representing the method to detect the undifferentiated and differentiated state of mNSCs using 3D GO-encapsulated AuNPs. Adapted from [139], with permission from ©2013 Elsevier.
Figure 15
Figure 15
(a) Raman spectrum (excitation at 632 nm) of GIANs showing the G and D bands of graphitic carbon; (b) Raman imaging of MCF-7 cells with and without GIAN staining. BF: bright field, scale bar: 10 μm; (c) Raman spectra of R6G molecules, with and without GIAN, and with AuNPs, respectively. The figures are adapted from [138], with permission from ©2014 Nature Publishing Group.

References

    1. Novoselov K.S., Geim A.K., Morozov S., Jiang D., Zhang Y., Dubonos S.A., Grigorieva I., Firsov A. Electric field effect in atomically thin carbon films. Science. 2004;306:666–669. doi: 10.1126/science.1102896. - DOI - PubMed
    1. Miller D.L., Kubista K.D., Rutter G.M., Ruan M., de Heer W.A., First P.N., Stroscio J.A. Observing the quantization of zero mass carriers in graphene. Science. 2009;324:924–927. doi: 10.1126/science.1171810. - DOI - PubMed
    1. Hirsch A. The era of carbon allotropes. Nat. Mater. 2010;9:868–871. doi: 10.1038/nmat2885. - DOI - PubMed
    1. Geim A.K., Novoselov K.S. The rise of graphene. Nat. Mater. 2007;6:183–191. doi: 10.1038/nmat1849. - DOI - PubMed
    1. Zhang Y., Tan Y.-W., Stormer H.L., Kim P. Experimental observation of the quantum hall effect and berry’s phase in graphene. Nature. 2005;438:201–204. doi: 10.1038/nature04235. - DOI - PubMed

LinkOut - more resources