. 2017 Aug 4;357(6350):498-502.
doi: 10.1126/science.aam5336.

The microbial metabolite desaminotyrosine protects from influenza through type I interferon

Affiliations

The microbial metabolite desaminotyrosine protects from influenza through type I interferon

Ashley L Steed et al. Science. .

Abstract

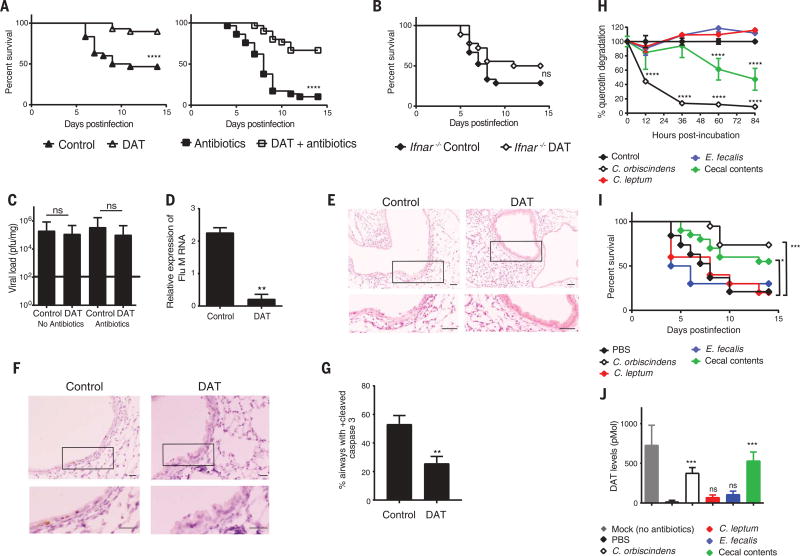
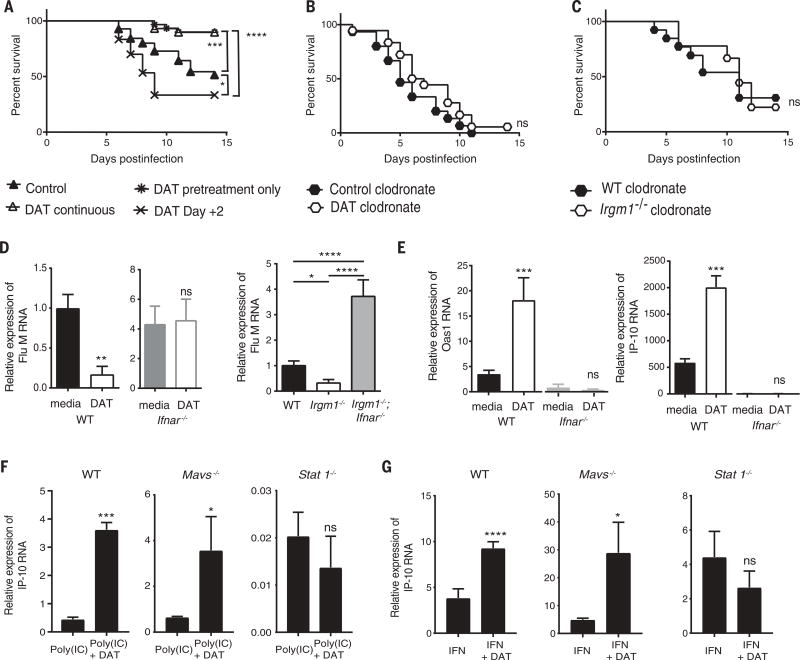
The microbiota is known to modulate the host response to influenza infection through as-yet-unclear mechanisms. We hypothesized that components of the microbiota exert effects through type I interferon (IFN), a hypothesis supported by analysis of influenza in a gain-of-function genetic mouse model. Here we show that a microbially associated metabolite, desaminotyrosine (DAT), protects from influenza through augmentation of type I IFN signaling and diminution of lung immunopathology. A specific human-associated gut microbe, Clostridium orbiscindens, produced DAT and rescued antibiotic-treated influenza-infected mice. DAT protected the host by priming the amplification loop of type I IFN signaling. These findings show that specific components of the enteric microbiota have distal effects on responses to lethal infections through modulation of type I IFN.


Figures

Fig. 1
Fig. 1. Irgm1−/− mice have elevated type I IFN in the lungs and are resistant to influenza
(A) Bioassay for type I IFN activity (see Methods) from lung homogenates of littermate control and Irgm1−/− mice (n = 19 to 21 mice per group from five experiments). (B) Relative mRNA expression of Oas2 and Mx2 by qRT-PCR from control and Irgm1−/− lung homogenates (n = 7 to 14 mice per group from three to four experiments). (C) Kaplan-Meier survival analysis of infected control, Irgm1−/−, Ifnar−/−, and Irgm1−/−;Ifnar−/− mice (n = 18 to 40 mice per group from three to five experiments). (D) Viral load for control and Irgm1−/− mice infected with influenza (n = 11 to 23 mice per group from four to five experiments for days 3 and 6 and n = 4 to 7 mice from two experiments for day 10). (E) Viral RNA transcript counts in the lungs of infected control and Irgm1−/− mice at day 3 postinfection. (F and G) Representative images of lung cross sections from control and Irgm1−/− mice 6 days postinfection. Boxed areas are magnified immediately below. (F) Hematoxylin and eosin (H&E)–stained sections. Scale bar, 50 µm. (G) Sections stained for cleaved caspase 3 by immunohistochemistry. Scale bar, 20 µm. (H) Percentage of airways positive for at least one cleaved caspase-positive cell within an airway cross section [n = 5 to 6 mice per group from two experiments for (F) to (H)]. Means ± SEM. ND, not detected. *P ≤ 0.05; **P < 0.01; ****P < 0.0001; and ns, not statistically significant. Mann-Whitney used for statistical analysis in (A), (B), (D), (E), and (H). Mantel-Cox test was used with Bonferroni-corrected threshold in (C).
Fig. 2
Fig. 2. A microbial-derived metabolite induces type I IFN activity
(A) Scatter plots displaying fold change in luminescence for 100 µM metabolite screen in the presence of 5 mg/ml poly(IC) treatment (left) or 10 U/ml type I IFN treatment (right). (B) Fold increase compared with control in luminescence for DAT at the indicated doses in the presence of specified doses of poly(IC) or type I IFN (n = three to four experiments). (C) Stool and serum DAT levels measured by mass spectroscopy in mice treated with either vehicle (mock) or 2 weeks of antibiotics (n = 9 to 15 mice per group from three experiments). (D) Serum IFN activity as measured by the IFN bioassay of poly(IC)- and DAT-treated mice after 2 weeks of antibiotics (n = 7 or 8 mice per group from two experiments). αIfnar, antibody against IFNAR. (E) Relative mRNA expression of ISGs from lung homogenates of mice treated with or without DAT (n = 5 samples per group from two experiments). Means ± SEM. ND, not detected. *P < 0.05, **P < 0.01. Analysis of variance (ANOVA) used for statistical analysis in (D) (F = 10.9) with Sidak's multiple-comparisons test. Mann-Whitney test was used in (C) and (E).
Fig. 3
Fig. 3. DAT protects from influenza via type I IFN signaling
(A) Kaplan-Meier survival analysis of groups of mice treated without antibiotics (left) or with a cocktail of broad-spectrum antibiotics (right, VNAM) and then treated with or without DAT before infection (n = 30 mice per group from two experiments, inclusive of all groups but plotted separately for clarity). (B) Kaplan-Meier survival analysis of Ifnar−/− mice treated with or without DAT and infected with influenza (n = 18 to 21 mice per group from two experiments). (C) Infectious viral load determined by plaque assay at day 5 postinfection for groups of mice from (A) (n = 10 mice per group from two experiments). (D) Matrix viral RNA expression determined by qRT-PCR from lung homogenates of mice treated with or without DAT as in (C). (E and F) Representative images of lung cross sections from mice treated with or without DAT at 5 days postinfection. Boxed areas are magnified immediately below. (E) H&E stained sections. Scale bar, 50 µm. (F) Sections stained for cleaved caspase 3 by immunohistochemistry. Scale bar, 20 µm. (G) Percentage of airways positive for at least one cleaved caspase–positive cell within an airway cross section [n = 10 mice per group from two experiments for (E) to (G)]. (H) Time course of quercetin degradation after incubation with control, mouse cecal contents, or single bacterial species (n = 6 replicates per group from two experiments). (I) Kaplan-Meier survival analysis of VNAM-pretreated mice gavaged twice with PBS, cecal contents, or single bacterial species and then infected with influenza (n = 20 mice per group from two experiments for PBS, cecal contents, C. orbiscindens gavage or 10 mice per group for C. leptum or E. fecalis gavage). (J) Stool DAT levels measured by mass spectroscopy at time of infection in mice from (I) (n = 10 per group). Statistical significance per group is compared with PBS-gavaged group. Means ± SEM. *P < 0.05; **P < 0.01; ***P < 0.001; ****P < 0.0001; and ns, not statistically significant. Mantel-Cox test with or without Bonferroni-corrected threshold used in (A), (B), and (I). Mann-Whitney test used in (C), (D), and (G). ANOVA used in (H) (F = 50.8) and (J) (F = 14.5) with Dunnett's multiple-comparisons test.
Fig. 4
Fig. 4. DAT enhances type I IFN in macrophages via type I IFN amplification
(A) Kaplan-Meier survival analysis of groups of mice with variations on the timing of DAT treatment with respect to infection. Control, no DAT; DAT continuous, 1 week pretreatment and continuous treatment postinfection; DAT pretreatment, 1 week pretreatment only; and DAT Day +2, treatment commenced 2 days postinfection (n = 30 mice per group from two experiments). (B) Kaplan-Meier survival analysis of mice all treated with clodronate liposomes and either control or DAT (n = 18 to 20 mice per group from two experiments). (C) Kaplan-Meier survival analysis of infected wild-type and Irgm1−/− mice all treated with clodronate liposomes (n = 9 to 13 mice per group from three experiments). (D) Relative expression of matrix influenza mRNA from wild-type and Ifnar−/− BMDMs pretreated with or without DAT and then infected (n = 7 replicates per group from two experiments for wild-type BMDMs and three replicates per group from three experiments for Ifnar−/− BMDMs). Matrix viral RNA expression determined by qRT-PCR from infected BMDMs from indicated genotypes (n = two to seven experiments). (E) Relative mRNA expression of Oas1 and IP-10 (as Cxcl10) by qRT-PCR from wild-type and Ifnar−/− BMDMs pretreated with or without DAT and then infected (n = 7 replicates per group from two experiments for wild-type BMDMs and three replicates per group from three experiments for Ifnar−/− BMDMs). (F) Relative mRNA expression of Cxcl10 (IP-10) by qRT-PCR from indicated genotypes treated with poly(IC) and with or without DAT (n = 4). (G) Relative mRNA expression of Cxcl10 (IP-10) by qRT-PCR from BMDMs from indicated genotypes treated with type I IFN and with or without DAT (n = 4). Graphs denote average with SEM displayed. *P < 0.05; **P < 0.01; ***P < 0.001; ****P < 0.0001; and ns, not statistically significant. Mantel-Cox test used with or without Bonferroni-corrected threshold for statistical analysis in (A), (B), and (C). Mann-Whitney test used in (D) to (G). ANOVA in (D) (F = 37.5) used Tukey's multiple-comparisons test.

Comment in

  • Take DAT, Flu!
    Lobel L, Garrett WS. Lobel L, et al. Immunity. 2017 Sep 19;47(3):400-402. doi: 10.1016/j.immuni.2017.09.002. Immunity. 2017. PMID: 28930655

References

    1. Yang Y, et al. Nature. 2014;510:152–156. - PMC - PubMed
    1. Chu H, et al. Science. 2016;352:1116–1120. - PMC - PubMed
    1. Arpaia N, et al. Nature. 2013;504:451–455. - PMC - PubMed
    1. Furusawa Y, et al. Nature. 2013;504:446–450. - PubMed
    1. Smith PM, et al. Science. 2013;341:569–573. - PMC - PubMed

Publication types