. 2017 Aug 3;50(2):1602367.
doi: 10.1183/13993003.02367-2016. Print 2017 Aug.

Senolytic drugs target alveolar epithelial cell function and attenuate experimental lung fibrosis ex vivo

Affiliations

Senolytic drugs target alveolar epithelial cell function and attenuate experimental lung fibrosis ex vivo

Mareike Lehmann et al. Eur Respir J. .

Abstract

Idiopathic pulmonary fibrosis (IPF) is a devastating lung disease with poor prognosis and limited therapeutic options. The incidence of IPF increases with age, and ageing-related mechanisms such as cellular senescence have been proposed as pathogenic drivers. The lung alveolar epithelium represents a major site of tissue injury in IPF and senescence of this cell population is probably detrimental to lung repair. However, the potential pathomechanisms of alveolar epithelial cell senescence and the impact of senolytic drugs on senescent lung cells and fibrosis remain unknown. Here we demonstrate that lung epithelial cells exhibit increased P16 and P21 expression as well as senescence-associated β-galactosidase activity in experimental and human lung fibrosis tissue and primary cells.Primary fibrotic mouse alveolar epithelial type (AT)II cells secreted increased amounts of senescence-associated secretory phenotype (SASP) factors in vitro, as analysed using quantitative PCR, mass spectrometry and ELISA. Importantly, pharmacological clearance of senescent cells by induction of apoptosis in fibrotic ATII cells or ex vivo three-dimensional lung tissue cultures reduced SASP factors and extracellular matrix markers, while increasing alveolar epithelial markers.These data indicate that alveolar epithelial cell senescence contributes to lung fibrosis development and that senolytic drugs may be a viable therapeutic option for IPF.


Conflict of interest statement

Conflict of interest: Disclosures can be found alongside this article at erj.ersjournals.com

Figures
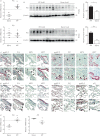
FIGURE 1
FIGURE 1
Senescence marker expression is upregulated in idiopathic pulmonary fibrosis (IPF) patients. a) Gene expression of P16 and P21 in lung homogenates of IPF and donor tissue was measured by quantitative (q)PCR and normalised to HPRT. Data are presented as mean±sem. n=6. Means were compared using unpaired t-tests. b) Representative and quantitative immunoblot analyses of subpleural lung tissue from patients with sporadic IPF (n=16) and human donor lungs (n=11) using specific antibodies against P16 and P21, and β-actin as loading control. Densitometric ratios of the respective protein to β-actin are given as mean±sem. Means were compared using unpaired t-tests. Immunohistochemical staining of serial sections of c) IPF or d) donor lung tissue for prosurfactant protein-C (proSP-C; marker for alveolar epithelial type (AT)II cells), cytokeratin 5 (KRT5, marker for bronchiolar basal cells), cytokeratin 7 (KRT7, marker for simple epithelial cells) and P16 and P21 protein. ProSP-C+ KRT7+ ATII cells expressing P16 or P21 are indicated by arrows; proSP-C KRT5 KRT7+ epithelial cells expressing P16 or P21 are indicated by arrowheads; proSP-C+ KRT5+ KRT7+ epithelial cells expressing P21 are indicated by dashed arrows. e) Gene expression of P16 and P21 in primary human ATII cells isolated from IPF and donor tissue was measured using qPCR and normalised to HPRT. Data are presented as mean±sem. n=4. Means were compared using unpaired t-tests. *: p<0.05; **: p<0.01; ***: p<0.001.
FIGURE 2
FIGURE 2
Senescence markers are upregulated in experimental lung fibrosis. Mice were instilled with PBS or bleomycin (Bleo) and sacrificed at the timepoints indicated. a) Gene expression of P16 and P21 in lung homogenates of mice sacrificed at day 7, 14 or 21 was measured using quantitative PCR and normalised to Hprt. Change in cycle threshold (ΔCt) is presented as mean±sem; n=3 for PBS and n=5 for Bleo. Statistical significance was tested using one-way ANOVA followed by Newman–Keuls' multiple comparison test. b) Immunoblot of P21 protein in mouse whole-lung homogenates of mice treated with PBS or Bleo and sacrificed after 7 or 14 days. β-Actin was used as a loading control. Respective sizes of marker are indicated. Data were quantified and normalised to loading control. Data are presented as mean±sem; n=9. Statistical significance was tested using one-way ANOVA followed by Newman-Keuls' multiple comparison test. c, d) Three-dimensional lung tissue cultures (3D-LTCs) were obtained from mice instilled with PBS or Bleo and sacrificed at day 14. 3D-LTCs were stained for senescence-associated β-galactosidase activity and c) macroscopic images and d) microscopic (magnification of 200× or 400×) images were taken. Epithelial cells are marked by arrows. e) Enrichment of senescence-associated genes [31] in microarray data of i) whole lung [32] (GSE16846), ii) mouse fibroblasts [33] (GSE42564) or iii) primary mouse (pm) alveolar epithelial type (AT)II cells [26] of mice with experimental lung fibrosis induced by Bleo. FDR: false discovery rate; FWER: family-wise error rate. *: p<0.05; ***: p<0.001.
FIGURE 3
FIGURE 3
Senescence markers are upregulated in alveolar epithelial type (AT)II cells in experimental lung fibrosis. Mice were instilled with either PBS or bleomycin (Bleo). At day 14 after instillation, mice were sacrificed and primary mouse (pm)ATII cells were isolated. a) Immunofluorescence staining of fibrotic or nonfibrotic pmATII cells on cover slips for epithelial cell marker expression at day 2 after isolation. Fluorescent images represent a 400× magnification. b) pmATII cells were analysed for epithelial cell adhesion molecule (EpCAM) positivity and senescence-associated (SA)-β-galactosidase activity by fluorescence-activated cell sorting (FACS) directly after isolation. Representative dot blots of the EpCAM+ population are shown for PBS and Bleo, as well as quantifications of percentages of senescent cells of the EpCAM+ population. Means were compared to time-matched PBS controls using unpaired t-tests; n=3. c) pmATII cells (day 2) were analysed for SA-β-galactosidase activity using FACS. Representative dot blots are shown for PBS and Bleo pmATII cells incubated with C12FDG or respective controls, a representative histogram comparing PBS and Bleo pmATII cells incubated with C12FDG as well as quantifications of percentages of senescent cells normalised to respective PBS control. Means were compared to time-matched PBS controls using unpaired t-tests; n=3. d) pmATII cells (day 2) were stained for SA-β-galactosidase activity and blue cells and total cells were counted. Representative images and quantitative data normalised to respective PBS controls are shown. Data represent mean±sem. Means were compared to time-matched PBS controls using unpaired t-tests; n=3. e) Gene expression of senescence-associated genes in freshly isolated pmATII cells from PBS- or Bleo-treated mice was measured using quantitative PCR. Data were normalised to Hprt. Change in threshold cycle (ΔCt) is presented as mean±sem; n=3–4 for PBS and n=8 for Bleo. Means were compared to time-matched PBS controls using unpaired t-tests. f–h) pmATII cells isolated from PBS- or Bleo-treated mice were plated onto plastic tissue culture plates. After 48 h of culture, the supernatant was collected and analysed using mass spectrometry proteomics. The senescence-associated secretory phenotype (SASP) list [9] was compared to the list of secreted proteins (1.5-fold upregulated or downregulated). f) A Venn diagram (BioVenn; [38]) showing the overlap of SASP proteins with the up-/downregulated proteins in the pmATII supernatant. g) Percentage of detected SASP factors that are upregulated (>1.5-fold) or downregulated (<-1.5-fold) or not changed. h) List of upregulated SASP components >1.5-fold Bleo/PBS. CK: cytokeratin; ZO: zona occludens; SMA: smooth muscle actin. *: p<0.05; ***: p<0.001.
FIGURE 4
FIGURE 4
Treatment of fibrotic primary mouse (pm) alveolar epithelial type (AT)II cells with senolytic drugs decreases senescent markers and increases apoptosis. Mice were instilled with either PBS or bleomycin (Bleo). At day 14 after instillation mice were sacrificed and pmATII cells were isolated. Fibrotic pmATII cells were cultured for 48 h in the presence of the senolytic drugs dasatinib (D; 200 nM) and quercetin (Q; 50 µM). a) The senolytic activity was assessed by cell numbers. Data are presented as normalised to dimethylsulfoxide (DMSO) control and as mean±sem. Significance was assessed using paired t-tests; n=3. b) Senescence-associated (SA)-β-galactosidase activity. pmATII cells were stained for SA-β-galactosidase activity and blue cells and total cells were counted. Quantitative data are normalised to respective DMSO control. Data are presented as mean±sem. Means were compared to time-matched controls using paired t-tests; n=4. c) Gene expression analysis for the senescence marker P16. Data were normalised to Hprt level. Data are presented as normalised to DMSO control and as mean±sem. Significance was assessed with paired t-tests; n=6. d) Representative images of immunofluorescence staining for apoptotic marker cleaved caspase 3 and E-cadherin in fibrotic pmATII cells exposed to DMSO or DQ. Fluorescent images represent a 630× magnification. Scale bars=20 µm. e) Fibrotic ATII cells were exposed to DMSO or DQ and stained for annexin V level and analysed using fluorescence-activated cell sorting (FACS); n=4. f) Fibrotic ATII cells were exposed to DQ and stained for senescence (C12FDG), co-stained for annexin V level and analysed using FACS. Data are presented as mean±sem percentage of total apoptotic cells in the senescent (C12FDG+) and nonsenescent (C12FDG) population. Significance was assessed using unpaired t-tests; n=3. g) Expression of senescence-associated secretory phenotype (SASP) markers in pmATII cells treated with senolytic drugs was analysed using quantitative PCR. Data were normalised to Hprt level. Change in threshold cycle (ΔCt) is presented as mean±sem. Significance was assessed using paired t-tests; n=6. Spp: secreted phosphoprotein; Mmp: matrix metalloproteinase. *: p<0.05; **: p<0.01; ***: p<0.001.
FIGURE 5
FIGURE 5
Treatment of fibrotic primary mouse (pm) alveolar epithelial type (AT)II cells with senolytic drugs decreases fibrotic and increases epithelial cell markers. Mice were instilled with either PBS or bleomycin (Bleo). At day 14 after instillation, mice were sacrificed and pmATII cells were isolated. Fibrotic pmATII cells were cultured for 48 h in the presence of senolytic drugs dasatinib (D; 200 nM) and quercetin (Q; 50 µM). a) Expression of fibrotic markers was analysed using quantitative (q)PCR. Data were normalised to Hprt level. Change in threshold cycle (ΔCt) is presented as mean±sem. Significance was assessed using paired t-tests; n=6. b) Expression of epithelial markers was analysed by qPCR. Data were normalised to Hprt level. ΔCt is presented as mean±sem. Significance was assessed using paired t-tests; n=6. c) Secretion of interleukin (IL)-6 was analysed using ELISA. Data are presented as normalised to PBS control treated with dimethylsulfoxide (DMSO) (mean±sem). Significance was assessed using paired t-tests; n=4. d) Secretion of Wnt-inducible signalling protein (WISP)1 in pmATII cells treated with senolytic drugs was analysed using ELISA. Data are presented as normalised to PBS control treated with DMSO (mean±sem). Significance was assessed using t-tests; n=4. e) Secretion of surfactant protein-C (SP-C) was analysed using ELISA. Data are presented as normalised to total cell protein amount. Significance was assessed using paired t-tests; n=4. f) i) E-cadherin expression was assessed using Western blotting. β-actin was used as a loading control; ii) quantification of E-cadherin Western blot; n=5. Data were normalised to β-actin. *: p<0.05; **: p<0.01; ***: p<0.001.
FIGURE 6
FIGURE 6
Treatment of fibrotic three-dimensional lung tissue cultures (3D-LTCs) with senolytic drugs decreases senescence markers and increases apoptosis markers. Mice were instilled with either PBS or bleomycin (Bleo). At day 14 after instillation mice were sacrificed and 3D-LTCs were generated. a) Gene expression of senescence markers in 3D-LTCs after 48 h of culture was analysed using quantitative (q)PCR. Data were normalised to Hprt. Change in threshold cycle (ΔCt) is presented as mean±sem. Significance was assessed using unpaired t-tests; n=8. b–e) Fibrotic 3D-LTCs were cultured for 48 h in the presence of senolytic drugs dasatinib (D; 200 nM) and quercetin (Q; 50 µM). The senolytic activity was assessed using b) senescence-associated β-galactosidase staining (i) 200×), as well as by c) gene expression analysis for the senescence marker P16. Data were normalised to Hprt. ΔCt is presented as mean±sem. Significance was assessed using paired t-tests; n=6. d) Representative images of immunofluorescence staining for the apoptotic marker cleaved caspase 3. i) Scale bars=50 µm; ii) scale bars=20 µm. Epithelial cells are marked by arrows. e) Gene expression of SASP markers in 3D-LTCs treated with senolytic drugs was analysed using qPCR. Data were normalised to Hprt. ΔCt is presented as mean±sem. Significance was assessed using paired t-tests; n=6. *: p<0.05; **: p< 0.01; ***: p<0.001.
FIGURE 7
FIGURE 7
Treatment of fibrotic three-dimensional lung tissue cultures (3D-LTCs) with senolytic drugs decreases fibrotic and increases epithelial cell markers. Mice were instilled with either PBS or bleomycin (Bleo). At day 14 after instillation mice were sacrificed and 3D-LTCs were generated. Fibrotic 3D-LTCs were cultured for 48 h in the presence of senolytic drugs dasatinib (D; 200 nM) and quercetin (Q; 50 µM). a) Gene expression of fibrotic markers in 3D-LTCs treated with senolytic drugs was analysed using quantitative (q)PCR. Data were normalised to Hprt. Change in threshold cycle (ΔCt) is presented as mean±sem. n=6. b) Gene expression of Sftpc in 3D-LTCs treated with senolytic drugs was analysed using qPCR. Data were normalised to Hprt. ΔCt is presented as mean±sem. n=5. c) Secretion of Wnt-inducible signalling protein (WISP)1 from 3D-LTCs treated with senolytic drugs was analysed using ELISA. Data are presented as normalised to PBS dimethylsulfoxide (DMSO) control (mean±sem). n=4. d) i) Prosurfactant protein-C (proSP-C) expression was assessed using Western blotting in fibrotic 3D-LTCs. β-actin was used as a loading control; ii) quantification of proSP-C protein relative to β-actin. n=3. e) i) Secreted collagen I was assessed using Western blotting in fibrotic 3D-LTCs; ii) quantification of secreted collagen I normalised to supernatant volume. n=7. Significance was assessed using paired t-tests. *: p<0.05; **: p<0.01; ***: p<0.001.

Comment in

References

    1. King TE Jr, Pardo A, Selman M. Idiopathic pulmonary fibrosis. Lancet 2011; 378: 1949–1961. - PubMed
    1. Wolters PJ, Collard HR, Jones KD. Pathogenesis of idiopathic pulmonary fibrosis. Annu Rev Pathol 2014; 9: 157–179. - PMC - PubMed
    1. King TE Jr, Bradford WZ, Castro-Bernardini S, et al. . A phase 3 trial of pirfenidone in patients with idiopathic pulmonary fibrosis. N Engl J Med 2014; 370: 2083–2092. - PubMed
    1. Richeldi L, du Bois RM, Raghu G, et al. . Efficacy and safety of nintedanib in idiopathic pulmonary fibrosis. N Engl J Med 2014; 370: 2071–2082. - PubMed
    1. Meiners S, Eickelberg O, Königshoff M. Hallmarks of the ageing lung. Eur Respir J 2015; 45: 807–827. - PubMed

Publication types

MeSH terms

Substances