. 2017 Nov 1;313(5):L752-L762.
doi: 10.1152/ajplung.00170.2017. Epub 2017 Aug 3.

Transglutaminase 2 in pulmonary and cardiac tissue remodeling in experimental pulmonary hypertension

Affiliations

Transglutaminase 2 in pulmonary and cardiac tissue remodeling in experimental pulmonary hypertension

Krishna C Penumatsa et al. Am J Physiol Lung Cell Mol Physiol. .

Abstract

Tissue matrix remodeling and fibrosis leading to loss of pulmonary arterial and right ventricular compliance are important features of both experimental and clinical pulmonary hypertension (PH). We have previously reported that transglutaminase 2 (TG2) is involved in PH development while others have shown it to be a cross-linking enzyme that participates in remodeling of extracellular matrix in fibrotic diseases in general. In the present studies, we used a mouse model of experimental PH (Sugen 5416 and hypoxia; SuHypoxia) and cultured primary human cardiac and pulmonary artery adventitial fibroblasts to evaluate the relationship of TG2 to the processes of fibrosis, protein cross-linking, extracellular matrix collagen accumulation, and fibroblast-to-myofibroblast transformation. We report here that TG2 expression and activity as measured by serotonylated fibronectin and protein cross-linking activity along with fibrogenic markers are significantly elevated in lungs and right ventricles of SuHypoxic mice with PH. Similarly, TG2 expression and activity, protein cross-linking activity, and fibrogenic markers are significantly increased in cultured cardiac and pulmonary artery adventitial fibroblasts in response to hypoxia exposure. Pharmacological inhibition of TG2 activity with ERW1041E significantly reduced hypoxia-induced cross-linking activity and synthesis of collagen 1 and α-smooth muscle actin in both the in vivo and in vitro studies. TG2 short interfering RNA had a similar effect in vitro. Our results suggest that TG2 plays an important role in hypoxia-induced pulmonary and right ventricular tissue matrix remodeling in the development of PH.

Keywords: pulmonary hypertension; pulmonary remodeling; right ventricular remodeling; tissue fibrosis; transglutaminase 2.


Figures

Fig. 1.
Fig. 1.
Fibrogenic marker and TG2 mRNA expression is upregulated in SuHypoxia-exposed mouse lung and RV tissues. Quantitative PCR analysis demonstrates the effect of normoxia (21% O2) and SuHypoxia (10.5% O2) on transglutaminase 2 (TG2), transforming growth factor-β1 (TGF-β1), type 1 collagen (Col1), fibronectin (Fn), and α-smooth muscle actin (α-SMA) levels in mouse lung, right ventricular (RV), and left ventricular (LV) tissues. Bar graphs demonstrate average fold change in mRNA expression normalized to mouse 18S ribosomal RNA by ΔΔCt method performed in triplicates. Data are presented as means ± SD. Statistical analysis was performed by t-test. P < 0.05 was considered statistically significant; ns, not significant; n = 4–6/group. *Significantly different compared with vehicle+normoxia control.
Fig. 2.
Fig. 2.
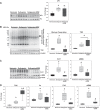
Pharmacological inhibition of TG2 activity blocks SuHypoxia-induced serotonylation of fibronectin, TG2 cross-linking activity, and protein and mRNA expression of Col1 and α-SMA in mouse lung tissue. Representative Western blot analysis of lung protein extracts from mice exposed to normoxia (21% O2), SuHypoxia (10.5% O2), and SuHypoxia+ERW1041E (ERW) showing serotonylated fibronectin (sFn; 220 kDa) and total fibronectin (Fn; 220 kDa) levels (A); transglutaminase 2 (TG2) reaction product [60 kDa; Nε-(γ-glutamyl)-lysine isopeptide bonds; Glu-Lys cross-links; denoted by arrow], TG2 (78 kDa), and β-actin (45 kDa) levels (B); and (C) type 1 collagen (Col1; 130 kDa), α-smooth muscle actin (α-SMA; 42 kDa), and β-actin levels. Each lane corresponds to protein extracts from an individual mouse. MW, molecular weight. Box plots demonstrate fold change in protein expression normalized to total Fn or β-actin assessed by densitometry analysis. D: quantitative PCR analysis demonstrates the effect of normoxia, SuHypoxia, and SuHypoxia+ERW1041E on TG2, Fn, Col1, and α-SMA levels in mouse lung tissues. Box plots demonstrate average fold change in mRNA expression normalized to 18S ribosomal RNA by ΔΔCt method performed in triplicates. Data are presented as 25th to 75th percentiles (boxes), medians (lines), and 5th and 95th percentiles (whiskers). Statistical analysis was performed by one-way ANOVA (Tukey post hoc test). P < 0.05 was considered statistically significant; ns, not significant; n = 6/group. *Significantly different compared with vehicle+normoxia control. #Significantly different compared with vehicle+SuHypoxia.
Fig. 3.
Fig. 3.
Pharmacological inhibition of TG2 activity blocks SuHypoxia-induced serotonylation of fibronectin, TG2 cross-linking activity, and protein expression of Col1 and α-SMA in mouse RV tissue. Representative Western blot analysis of RV protein extracts from mice exposed to normoxia (21% O2), SuHypoxia (10.5% O2), and SuHypoxia+ERW1041E (ERW) showing serotonylation of fibronectin (sFn; 220 kDa) and total fibronectin (Fn; 220 kDa) levels (A); transglutaminase 2 (TG2) reaction product [60 kDa; Nε-(γ-glutamyl)-lysine isopeptide bonds; Glu-Lys cross-links; denoted by arrow], TG2 (78 kDa) and β-actin (45 kDa) levels (B); and type 1 collagen (Col1; 130 kDa), α-smooth muscle actin (α-SMA; 42 kDa), and β-actin levels (C). Each lane corresponds to protein extracts from an individual mouse. Box plots demonstrate fold change in protein expression normalized to total Fn or β-actin assessed by densitometry analysis. Data are presented as 25th to 75th percentiles (boxes), medians (lines), and 5th and 95th percentiles (whiskers). Statistical analysis was performed by one-way ANOVA (Tukey post hoc test). P < 0.05 was considered statistically significant; n = 6/group. *Significantly different compared with vehicle+normoxia control. #Significantly different compared with vehicle+SuHypoxia.
Fig. 4.
Fig. 4.
Hypoxia exposure stimulated TG2, Col1, and myofibroblast transdifferentiation marker, α-SMA, expression in human RV cardiac fibroblasts. A: representative immunostained images for α-smooth muscle actin (α-SMA; red) and nucleus [4′,6-diamidino-2-phenylindole (DAPI); blue] in RV cardiac fibroblasts exposed to normoxia (21% O2) and hypoxia (3% O2) for 24 h. B: Western blots of protein extracts from RV cardiac fibroblasts exposed to normoxia (Nor) and hypoxia (Hyp) for 24, 48, and 72 h showing transglutaminase 2 (TG2; 78 kDa), fibronectin (Fn; 220 kDa), type 1 collagen (Col1; 147 kDa), α-smooth muscle actin (α-SMA; 42 kDa), and β-actin (45 kDa) levels. Representative blots of three independent experiments performed in duplicates/triplicates. Bar graphs demonstrate fold change in protein expression assessed by normalizing to β-actin levels at each time point by densitometry analysis. Data are presented as means ± SD. Statistical analysis was performed by t-test. P < 0.05 was considered statistically significant; ns, not significant; n = 6–9/group. *Significantly different compared with normoxia control.
Fig. 5.
Fig. 5.
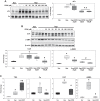
Hypoxia-induced fibrogenesis is mediated by TG2 activity in human RV cardiac fibroblasts. Western blots of protein extracts from RV cardiac fibroblasts pretreated with vehicle control (DMSO) and increasing concentrations (25–100 µM) of TG2 inhibitor, ERW1041E (ERW), followed by normoxia (Nor; 21% O2) and hypoxia (Hyp; 3% O2) exposure for 72 h showing serotonylated fibronectin (sFn; 220 kDa) and total Fn (220 kDa) levels (A) and type 1 collagen (Col1; 147 kDa), α-smooth muscle actin (α-SMA; 42 kDa), and β-actin (45 kDa) levels (B). Representative of three independent experiments performed in duplicates/triplicates. Box plots demonstrate fold change in protein expression normalized to total Fn or β-actin assessed by densitometry analysis. C: quantitative PCR analysis demonstrates the effect of pretreatment with vehicle control (DMSO) and ERW (100 µM), followed by normoxia and hypoxia exposure for 72 h, on TG2, Fn, Col1, and α-SMA mRNA levels in RV cardiac fibroblasts. Box plots demonstrate average fold change in mRNA expression normalized to 18S ribosomal RNA by ΔΔCt method performed in triplicates. Data are presented as 25th to 75th percentiles (boxes), medians (lines), and 5th and 95th percentiles (whiskers). Statistical analysis was performed by one-way ANOVA (Tukey post hoc test). P < 0.05 was considered statistically significant; ns, not significant; n = 6–9/group. *Significantly different compared with vehicle+normoxia control. #Significantly different compared with vehicle+hypoxia control.
Fig. 6.
Fig. 6.
Hypoxia-induced fibrogenesis is mediated by TG2 expression in human RV cardiac fibroblasts. Western blots of protein extracts from RV cardiac fibroblasts transfected with control siRNA and TG2 siRNA and exposed to normoxia (Nor; 21% O2) or hypoxia (Hyp; 3% O2) exposure for 72 h showing transglutaminase 2 (TG2; 78 kDa), serotonylated fibronectin (sFn; 220 kDa), type 1 collagen (Col1; 147 kDa), α-smooth muscle actin (α-SMA; 42 kDa), and β-actin (45 kDa) levels. Representative blots of three independent experiments performed in duplicates. Box plots demonstrate fold change in protein expression normalized to total β-actin assessed by densitometry analysis. Data are presented as 25th to 75th percentiles (boxes), medians (lines), and 5th and 95th percentiles (whiskers). Statistical analysis was performed by one-way ANOVA (Tukey post hoc test). P < 0.05 was considered statistically significant; n = 6/group. *Significantly different compared with control siRNA+normoxia. #Significantly different compared with control siRNA+hypoxia.
Fig. 7.
Fig. 7.
Hypoxia-induced fibrogenesis is mediated by TG2 activity in human PA adventitial fibroblasts. Western blots of protein extracts from PA adventitial fibroblasts pretreated with vehicle control (DMSO) and increasing concentrations (25–100 µM) of TG2 inhibitor, ERW1041E (ERW), followed by normoxia (Nor; 21% O2) and hypoxia (Hyp; 3% O2) exposure for 72 h showing serotonylated fibronectin (sFn; 220 kDa) and total Fn (220 kDa) levels (A) and type 1 collagen (Col1; 147 kDa), α-smooth muscle actin (α-SMA; 42 kDa), and β-actin (45 kDa) levels (B). Representative blots of three independent experiments performed in duplicates/triplicates. Box plot demonstrating fold change in protein expression normalized to total Fn or β-actin assessed by densitometry analysis. Data are presented as 25th to 75th percentiles (boxes), medians (lines), and 5th and 95th percentiles (whiskers). Statistical analysis was performed by one-way ANOVA (Tukey post hoc test). P < 0.05 was considered statistically significant; n = 6–9/group. *Significantly different compared with vehicle+normoxia control. #Significantly different compared with vehicle+hypoxia.

Similar articles

Cited by

References

    1. Alaa M, Abdellatif M, Tavares-Silva M, Oliveira-Pinto J, Lopes L, Leite S, Leite-Moreira AF, Lourenço AP. Right ventricular end-diastolic stiffness heralds right ventricular failure in monocrotaline-induced pulmonary hypertension. Am J Physiol Heart Circ Physiol 311: H1004–H1013, 2016. doi:10.1152/ajpheart.00202.2016. - DOI - PubMed
    1. Al-Naamani N, Preston IR, Paulus JK, Hill NS, Roberts KE. Pulmonary arterial capacitance is an important predictor of mortality in heart failure with a preserved ejection fraction. JACC Heart Fail 3: 467–474, 2015. doi:10.1016/j.jchf.2015.01.013. - DOI - PMC - PubMed
    1. Archer SL, Fang YH, Ryan JJ, Piao L. Metabolism and bioenergetics in the right ventricle and pulmonary vasculature in pulmonary hypertension. Pulm Circ 3: 144–152, 2013. doi:10.4103/2045-8932.109960. - DOI - PMC - PubMed
    1. Assad TR, Hemnes AR. Metabolic dysfunction in pulmonary arterial hypertension. Curr Hypertens Rep 17: 20, 2015. doi:10.1007/s11906-014-0524-y. - DOI - PMC - PubMed
    1. Austin ED, Lahm T, West J, Tofovic SP, Johansen AK, Maclean MR, Alzoubi A, Oka M. Gender, sex hormones and pulmonary hypertension. Pulm Circ 3: 294–314, 2013. doi:10.4103/2045-8932.114756. - DOI - PMC - PubMed

LinkOut - more resources