. 2017 Aug 4;8(1):188.
doi: 10.1038/s41467-017-00266-4.

Solution nuclear magnetic resonance spectroscopy on a nanostructured diamond chip

Affiliations

Solution nuclear magnetic resonance spectroscopy on a nanostructured diamond chip

P Kehayias et al. Nat Commun. .

Abstract

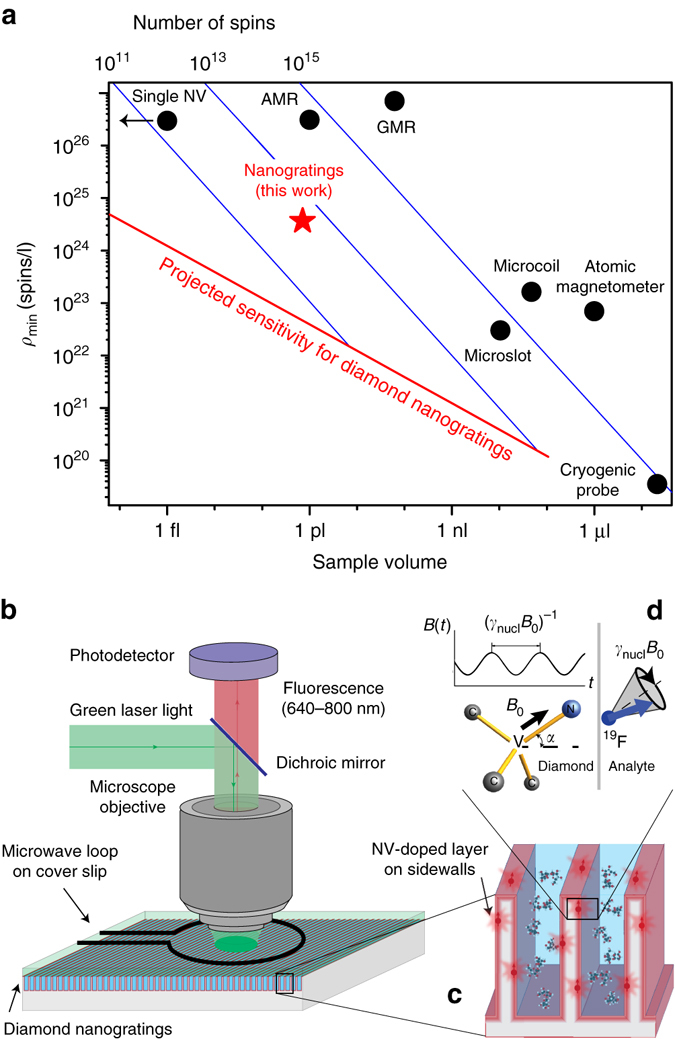
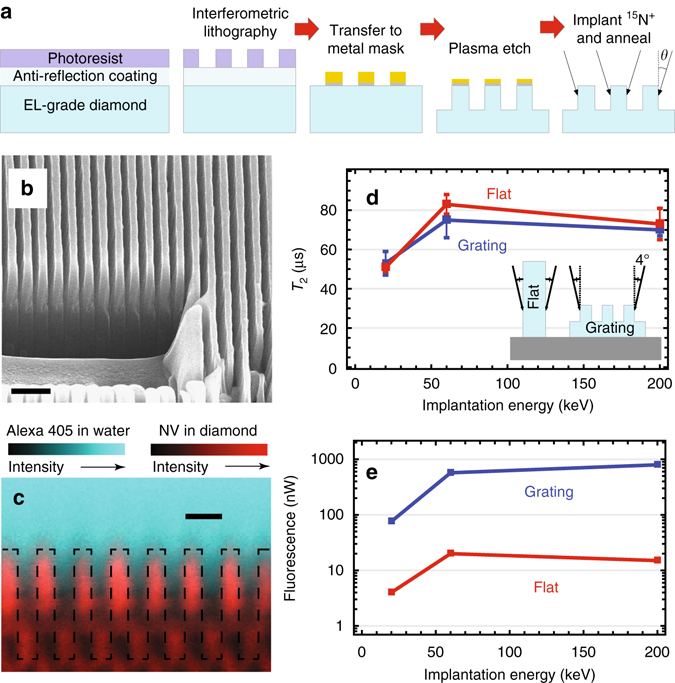
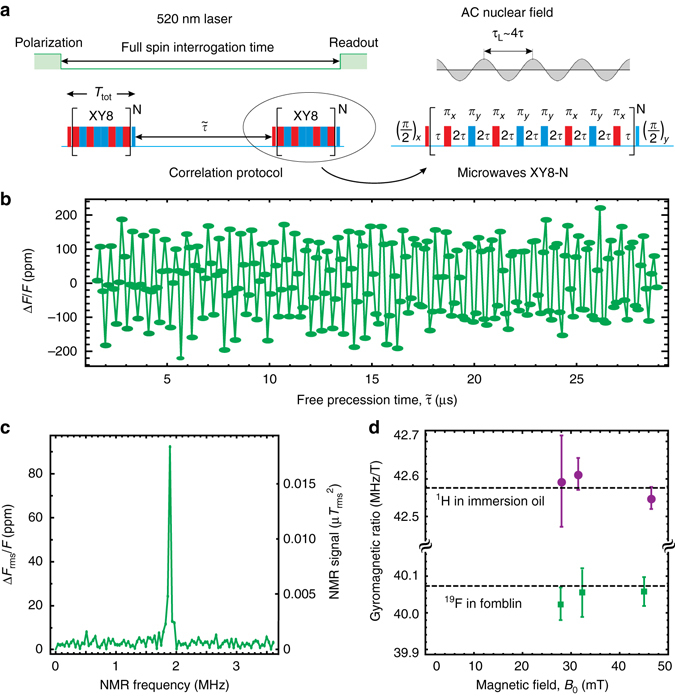
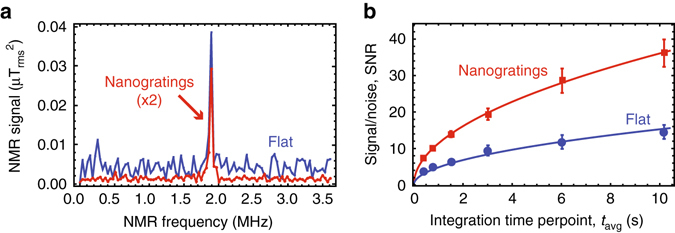
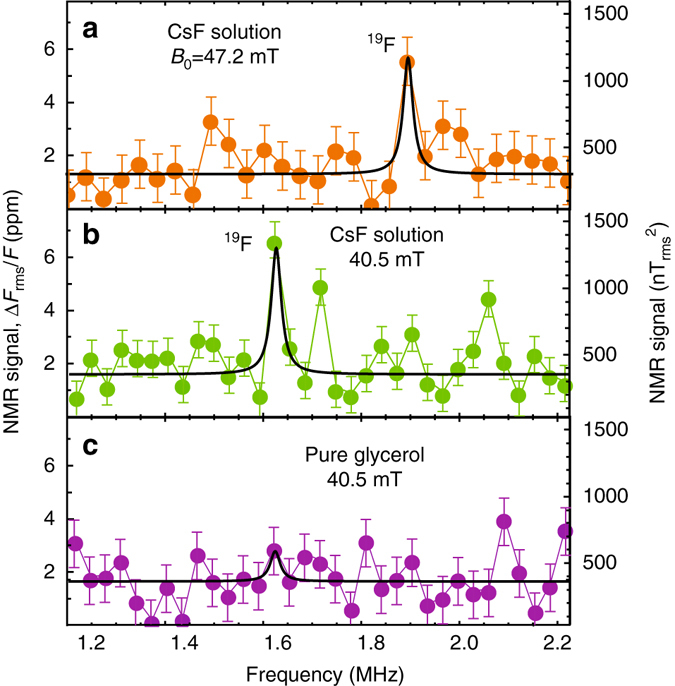
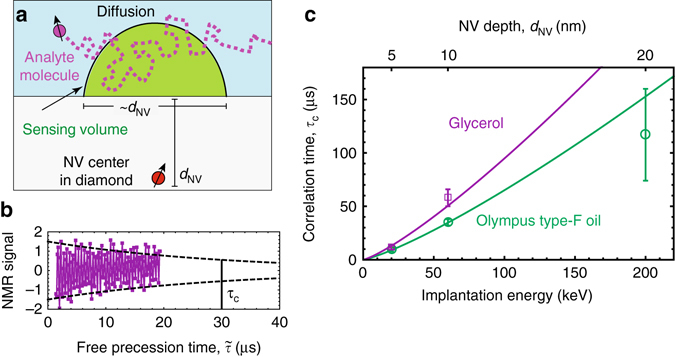
Sensors using nitrogen-vacancy centers in diamond are a promising tool for small-volume nuclear magnetic resonance (NMR) spectroscopy, but the limited sensitivity remains a challenge. Here we show nearly two orders of magnitude improvement in concentration sensitivity over previous nitrogen-vacancy and picoliter NMR studies. We demonstrate NMR spectroscopy of picoliter-volume solutions using a nanostructured diamond chip with dense, high-aspect-ratio nanogratings, enhancing the surface area by 15 times. The nanograting sidewalls are doped with nitrogen-vacancies located a few nanometers from the diamond surface to detect the NMR spectrum of roughly 1 pl of fluid lying within adjacent nanograting grooves. We perform 1H and 19F nuclear magnetic resonance spectroscopy at room temperature in magnetic fields below 50 mT. Using a solution of CsF in glycerol, we determine that 4 ± 2 × 10¹² 19F spins in a 1 pl volume can be detected with a signal-to-noise ratio of 3 in 1 s of integration.Nitrogen vacancy (NV) centres in diamond can be used for NMR spectroscopy, but increased sensitivity is needed to avoid long measurement times. Kehayias et al. present a nanostructured diamond grating with a high density of NV centres, enabling NMR spectroscopy of picoliter-volume solutions.


Conflict of interest statement

A.J., D.B., and L.B. are co-founders of startup ODMR Technologies and have financial interests in the company. The remaining authors declare no competing financial interests.

Figures

Fig. 1
Fig. 1
Picoliter NMR. a Overview of ambient-temperature NMR techniques for small volumes. Points represent experimental values for minimum-detectable nuclear spin concentration in 1 s with SNR = 3 for different techniques: microslot, microcoil, cryogenic probes, atomic vapor magnetometers, giant magnetoresistance (GMR) sensors, anistropic magnetoresistance (AMR) sensors, single NV centers, and NV-doped nanogratings (this work). The solid red line is the projected sensitivity for diamond nanogratings (Eq. (1)), exhibiting volume−1/2 scaling (see Supplementary Note 1). Solid blue lines indicate constant numbers of spins. b Epifluorescence diamond NMR set-up. c The sensor region consists of dense, high aspect-ratio diamond nanogratings fabricated via interferometric lithography and doped with NV centers. d Experimental geometry. The analyte’s precessing nuclear statistical polarization produces an oscillating magnetic field, which is sensed by adjacent near-surface NV centers
Fig. 2
Fig. 2
Diamond nanogratings. a Schematic of large-area nanofabrication process. b Scanning electron micrograph of 400 nm pitch diamond nanogratings. Focused ion beam etching prior to imaging enabled visualization of the nanogratings’ cross-section. Scale bar is 1 μm. c Confocal microscopy images reveal that fluorescence from dye-stained water originates from areas inside the nanograting grooves, confirming wetting. Dashed lines represent the estimated diamond–water boundary. Scale bar is 500 nm. d Comparison of T2, measured with the XY8-22 protocol, and e fluorescence intensity between flat and nanograting chips implanted at similar conditions. T2 can surpass ~100 μs with sufficient decoupling π-pulses (see Supplementary Note 2). Error bars in d represent standard error of the mean
Fig. 3
Fig. 3
Nanoscale NMR. a Sensing protocols: optical pulses are used to pump and probe NV spin state via the spin-dependent fluorescence; microwave multipulse sequences are applied between optical pump and probe pulses. Red and blue color indicates different microwave phases, which are shifted relative to each other by 90°. NV centers are resonantly tuned to detect a particular nuclear species by setting 4τ = τL, where 2τ is the separation between π-pulses and τL is the nuclear precession period. In order to reject common-mode noise the sequences are repeated with the phase of the last π/2-pulse shifted by 180°. The resulting signals are then subtracted and normalized to give the measurement results. b Time-domain NMR signal for 19F nuclei in Fomblin® oil taken using XY8-13 correlation sequence. c 19F frequency-domain NMR signal at B0 = 47.1 mT obtained by Fourier transform of the data in b. d Measured 1H and 19F gyromagnetic ratios at different B0 values. Dashed lines are literature values. Error bars represent standard error of the mean
Fig. 4
Fig. 4
NV NMR sensitivity characterization. a 19F NMR signal from Fomblin® oil at B0 = 47.1 mT for flat and nanograting sensors implanted at 20 keV using XY8-13 correlation sequence. b NMR signal-to-noise ratio as a function of averaging time. Fits to the function SNR = αtavg give good agreement for both sensors (solid lines). The coefficient α was 2.4 times larger for the nanograting chip. Error bars represent standard error of the mean
Fig. 5
Fig. 5
Solution NMR. a, b NMR spectra of 20% by weight CsF solution in glycerol at 47.2 and 40.5 mT. c NMR spectrum of pure glycerol. All spectra were measured with an XY8-10 correlation spectroscopy pulse sequence tuned to the 19F precession frequency. Each spectrum was fit to a single Lorentzian function with central frequency set to the anticipated 19F Larmor frequency. The linewidth was fixed to that of the 1H linewidth in glycerol obtained under similar conditions. The only free fit parameters were peak amplitude and offset. We assume that each spectrum contains at most one NMR line (from 19F) and other fluctuations are due to noise. Error bars represent standard deviation of off-resonant points
Fig. 6
Fig. 6
Diffusion-limited NMR. a Diffusion of analyte molecules through the sensing volume. b Example of temporal decay of the correlation signal for immersion oil. The decay is exponential with a characteristic correlation time τC. Dashed line represents the decay envelope. c Correlation time τC as a function of nitrogen implantation energy for immersion oil and glycerol. Error bars represent fit uncertainty. Solid lines are fits to the one-sided diffusion model discussed in the text

References

    1. Lee H, Sun E, Ham D, Weissleder R. Chip-NMR biosensor for detection and molecular analysis of cells. Nat. Med. 2008;14:869–874. doi: 10.1038/nm.1711. - DOI - PMC - PubMed
    1. Ha D, Paulsen J, Sun N, Song Y-Q, Ham D. Scalable NMR spectroscopy with semiconductor chips. Proc. Natl Acad. Sci. USA. 2014;111:11955–11960. doi: 10.1073/pnas.1402015111. - DOI - PMC - PubMed
    1. Rubakhin SS, Romanova EV, Nemes P, Sweedler JV. Profiling metabolites and peptides in single cells. Nat. Methods. 2011;8:S20–S29. doi: 10.1038/nmeth.1549. - DOI - PMC - PubMed
    1. Fratila RM, Velders AH. Small-volume nuclear magnetic resonance spectroscopy. Annu. Rev. Anal. Chem. 2011;4:227–249. doi: 10.1146/annurev-anchem-061010-114024. - DOI - PubMed
    1. Lacey ME, Subramanian R, Olson DL, Webband AG, Sweedler JV. High-resolution NMR spectroscopy of sample volumes from 1 nL to 10 μL. Chem. Rev. 1999;99:3133–3152. doi: 10.1021/cr980140f. - DOI - PubMed

Publication types