. 2017 Aug 3;7(1):7191.
doi: 10.1038/s41598-017-07497-x.

Ndrg1 promotes adipocyte differentiation and sustains their function

Affiliations

Ndrg1 promotes adipocyte differentiation and sustains their function

Kai Cai et al. Sci Rep. .

Abstract

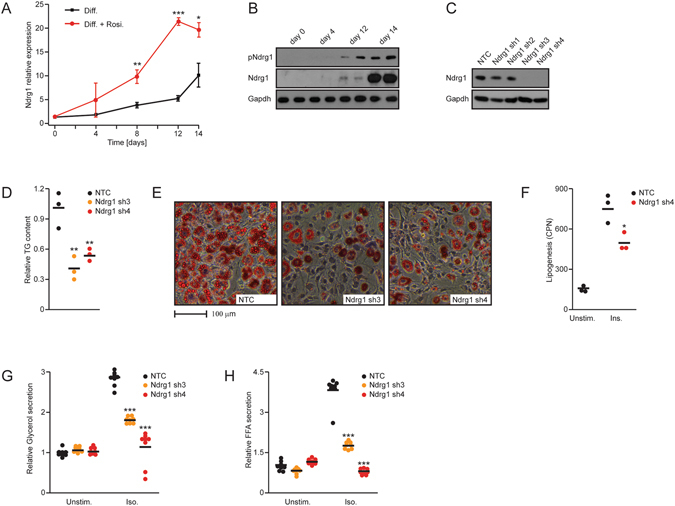
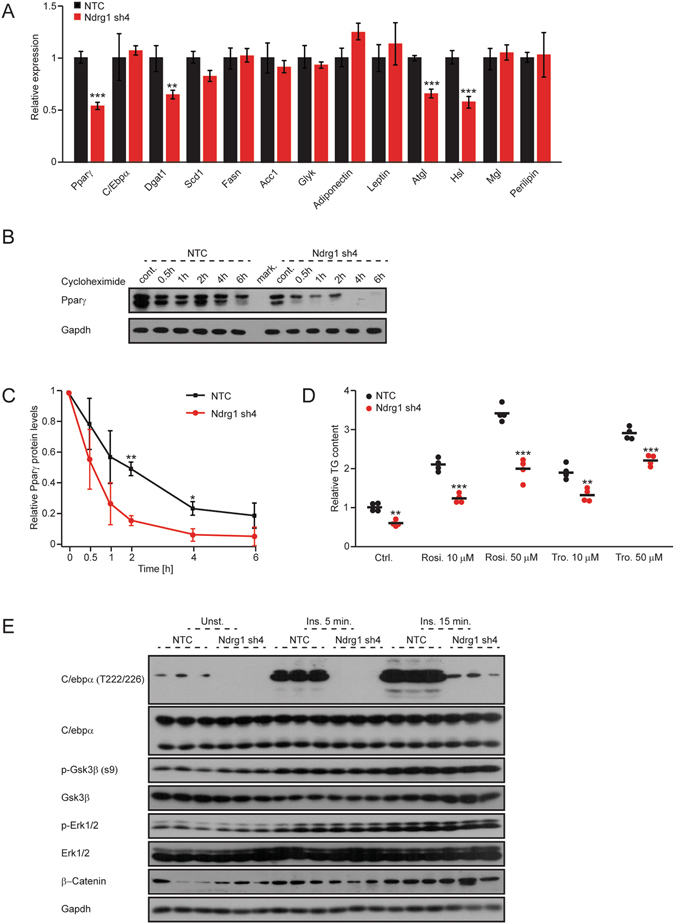
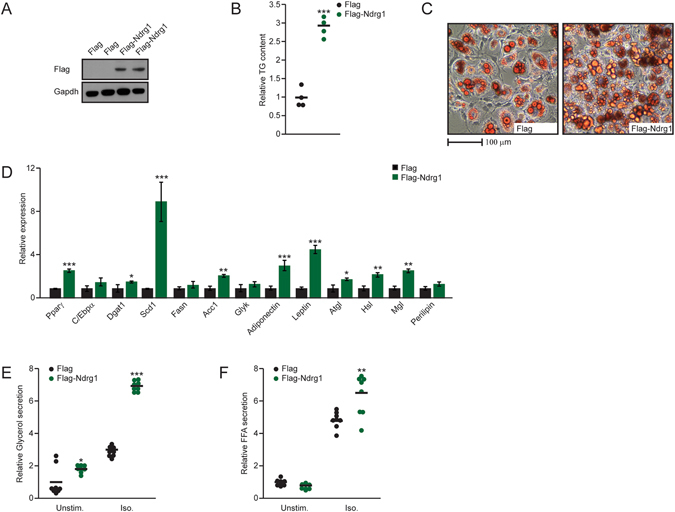
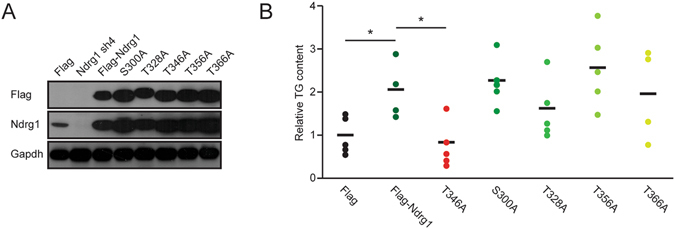
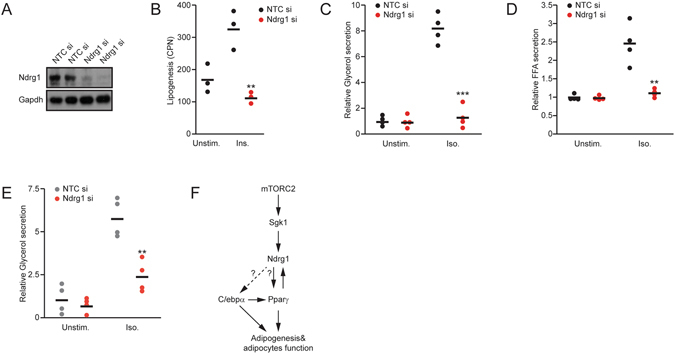
Adipocytes play a central role in maintaining metabolic homeostasis in the body. Differentiation of adipocyte precursor cells requires the transcriptional activity of peroxisome proliferator-activated receptor-γ (Pparγ) and CCAAT/enhancer binding proteins (C/Ebps). Transcriptional activity is regulated by signaling modules activated by a plethora of hormones and nutrients. Mechanistic target of rapamacin complexes (mTORC) 1 and 2 are central for the coordination of hormonal and nutritional inputs in cells and are essential for adipogenesis. Serum glucocorticoid kinase 1 (Sgk1)-dependent phosphorylation of N-Myc downstream-regulated gene 1 (Ndrg1) is a hallmark of mTORC2 activation in cells. Moreover, Pparγ activation promotes Ndrg1 expression. However, the impact of Ndrg1 on adipocyte differentiation and function has not yet been defined. Here, we show that Ndrg1 expression and its Sgk1-dependent phosphorylation are induced during adipogenesis. Consistently, we demonstrate that Ndrg1 promotes adipocyte differentiation and function by inducing Pparγ expression. Additionally, our results indicate that Ndrg1 is required for C/Ebpα phosphorylation. Moreover, we found that Ndrg1 phosphorylation by Sgk1 promotes adipocyte formation. Taken together, we show that induction of Ndrg1 expression by Pparγ and its phosphorylation by Sgk1 kinase are required for the acquisition of adipocyte characteristics by precursor cells.


Conflict of interest statement

The authors declare that they have no competing interests.

Figures

Figure 1
Figure 1
Ndrg1 promotes adipocyte differentiation and lipolysis. (A) Expression of Ndrg1 mRNA in 3t3l1 cells at different stages of differentiation with or without rosiglitazone (Rosi). Stars indicate significance between expression levels in control and Rosi-treated cells at the specific time points (*P < 0.05, **P < 0.01, ***P < 0.001 according to a t-test). (B) Total and phospho-Ndrg1 levels at different stages of 3t3l1 differentiation. (C) Ndrg1 protein levels in cells targeted by different shRNAs against Ndrg1 (Ndrg1 sh). (D) Relative TG content and (E) neutral lipid staining (OilRedO) on differentiated 3t3l1 cells after knockdown of Ndrg1. (F) Lipogenesis rate in control and Ndrg1 sh cells, unstimulated (unstim.) or upon insulin (Ins.) stimulation. (G) Relative glycerol and (H) FFA levels in medium from differentiated 3t3l1 control cells or Ndrg1 knockdown cells stimulated with control medium or isoproterenol (Iso). For all graphs, each data point represents a biological replicate. Stars indicate significance for given parameters between control and Ndrg1-depleted cells. (*P < 0.05, **P < 0.01, ***P < 0.001 according to ANOVA followed by the Post hoc Tukey test).
Figure 2
Figure 2
Ndrg1 promotes Pparγ expression and stability as well as C/Ebpα phosphorylation. (A) Relative mRNA levels for indicated genes in control and Ndrg1-deficient differentiated 3t3l1 cells. (n = 3, *P < 0.05, **P < 0.01, ***P < 0.001 according to t-test). (B) Western blot for Pparγ and Gapdh in control and Ndrg1-depleted differentiated 3t3l1 cells stimulated with cycloheximide for indicated time points. Representative picture was chosen from three biological replicates. (C) Quantification of relative amount of Pparγ in cells treated with cycloheximide in relation to the initial (without treatment) levels of Pparγ in respective control and Ndrg1-depleted cells (n = 3, *P < 0.05, **P < 0.01 according to t-test). (D) Relative TG content in control and Ndrg1 sh 3t3l1 cells subjected to adipocyte differentiation cocktail with rosiglitazone (Rosi) or troglitazone (Tro). Each data point represents a biological replicate. Stars indicate significance for given parameters between control and Ndrg1-depleted cells. (*P < 0.05, **P < 0.01, ***P < 0.001 according to ANOVA followed by the Post hoc Tukey test). (E) Western blot analysis using indicated antibodies in control and Ndrg1-deficient cells stimulated with insulin (Ins.) for the indicated time.
Figure 3
Figure 3
Overexpression of Ndrg1 promotes adipogenesis. (A) Western blot using indicated antibodies on extracts isolated from 3t3l1 control and FlagNdrg1-expressing cells. (B) Relative TG content and (C) neutral lipid staining (OilRedO) of differentiated 3t3l1 control and FlagNdrg1-expressing cells. (D) Relative mRNA levels for indicated genes in differentiated control and Ndrg1-overexpressing 3t3l1 cells. (F) Relative glycerol and (G) FFA levels in medium from differentiated 3t3l1 control cells or Ndrg1-overexpressing cells stimulated with control medium or Iso. Each data point represents a biological replicate (for bar plots n = 3). Stars indicate significance for given parameters between control and Ndrg1- overexpressing cells. (*P < 0.05, **P < 0.01, ***P < 0.001 according to ANOVA followed by the Post hoc Tukey test).
Figure 4
Figure 4
Sgk1-dependent phosphorylation of Ndrg1 is required for its pro-adipogenic function. (A) Western blot assessing the levels of expression of different FlagNdrg1 phospho-mutant proteins using the indicated antibodies. (B) Relative TG content in differentiated 3t3l1 cells expressing the indicated phospho-mutants of Ndrg1. Each data point represents an average TG content of individually generated and differentiated mixed stable cell populations of 3t3l1 cells expressing different Ndrg1 mutants. (*P < 0.05 according to ANOVA followed by the Post hoc Tukey test).
Figure 5
Figure 5
Ndrg1 promotes lipolysis independent of its impact on adipocyte differentiation. (A) Western blot for the indicated proteins in differentiated 3t3l1 cells transfected with control or Ndrg1 siRNA. (B) Lipogenesis rate in control siRNA and Ndrg1 siRNA transfected cells (Ndrg1 si), unstimulated (unstim.) or upon insulin (Ins.) stimulation. (C) Relative glycerol and (D) FFA levels in medium from differentiated 3t3l1 control cells or Ndrg1 siRNA-treated cells stimulated with control medium or Iso. (E) Relative glycerol levels in adipocytes differentiated from primary stroma-vascular cells isolated from subcutaneous fat pads and transfected with non-targeted control (NTC) or Ndrg1 siRNA. Each data point represents a biological replicate. Stars indicate significance for given parameters between control and Ndrg1-depleted cells. (*P < 0.05, **P < 0.01, ***P < 0.001 according to ANOVA followed by the Post hoc Tukey test). (F) Model of Ndrg1 action in adipocytes. mTORC2 activates Sgk1 kinase, which phosphorylates Ndrg1 on T346. Phosphorylated Ndrg1 increases expression of Pparγ through an unknown mechanism to promote adipogenesis and adipocyte function. In a positive feedback loop, Pparγ also promotes Ndrg1 expression and stability. Additionally, Ndrg1 promotes C/Ebpα phosphorylation, which might influence its activity.

References

    1. Rosen ED, Spiegelman BM. What we talk about when we talk about fat. Cell. 2014;156:20–44. doi: 10.1016/j.cell.2013.12.012. - DOI - PMC - PubMed
    1. Cristancho AG, Lazar MA. Forming functional fat: a growing understanding of adipocyte differentiation. Nat Rev Mol Cell Biol. 2011;12:722–734. doi: 10.1038/nrm3198. - DOI - PMC - PubMed
    1. Lefterova MI, Lazar MA. New developments in adipogenesis. Trends Endocrinol Metab. 2009;20:107–114. doi: 10.1016/j.tem.2008.11.005. - DOI - PubMed
    1. Laplante M, Sabatini DM. mTOR signaling in growth control and disease. Cell. 2012;149:274–293. doi: 10.1016/j.cell.2012.03.017. - DOI - PMC - PubMed
    1. Zhang HH, et al. Insulin stimulates adipogenesis through the Akt-TSC2-mTORC1 pathway. PLoS One. 2009;4:e6189. doi: 10.1371/journal.pone.0006189. - DOI - PMC - PubMed

Publication types

MeSH terms

Substances

LinkOut - more resources