. 2017 Aug 3;7(1):7188.
doi: 10.1038/s41598-017-07694-8.

High resolution 3-Dimensional imaging of the human cardiac conduction system from microanatomy to mathematical modeling

Affiliations

High resolution 3-Dimensional imaging of the human cardiac conduction system from microanatomy to mathematical modeling

Robert S Stephenson et al. Sci Rep. .

Abstract

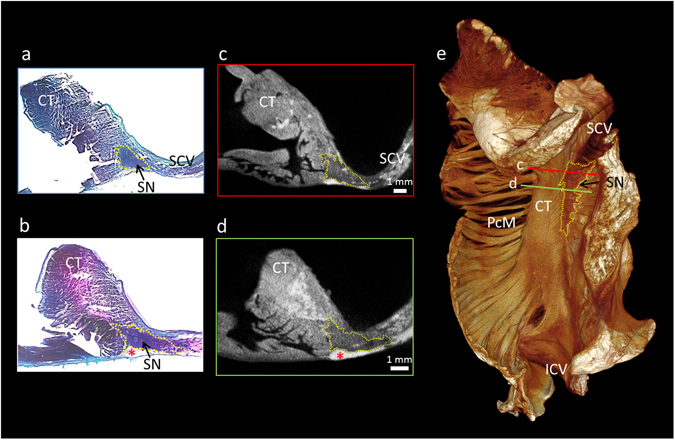
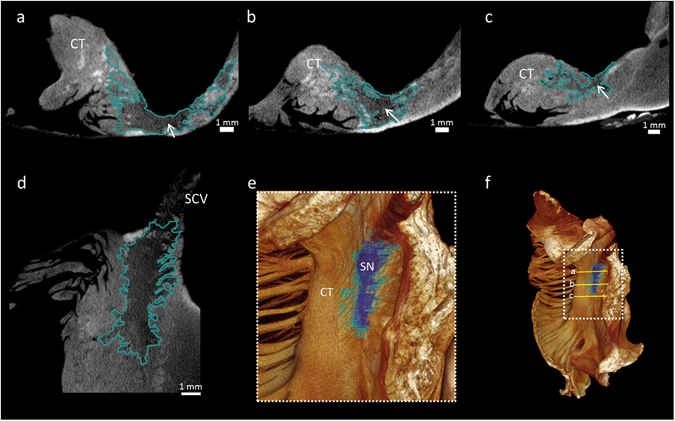
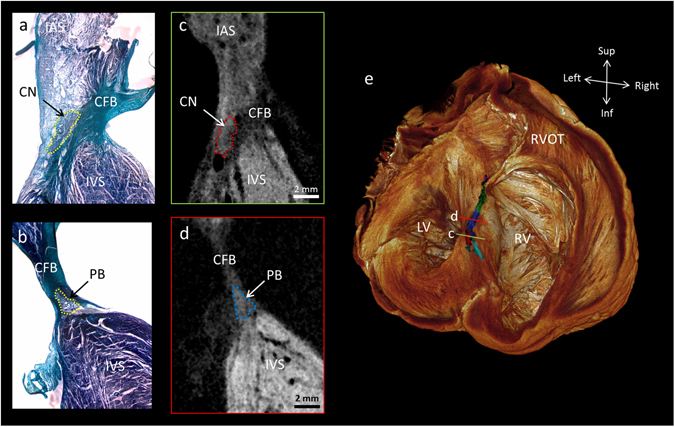
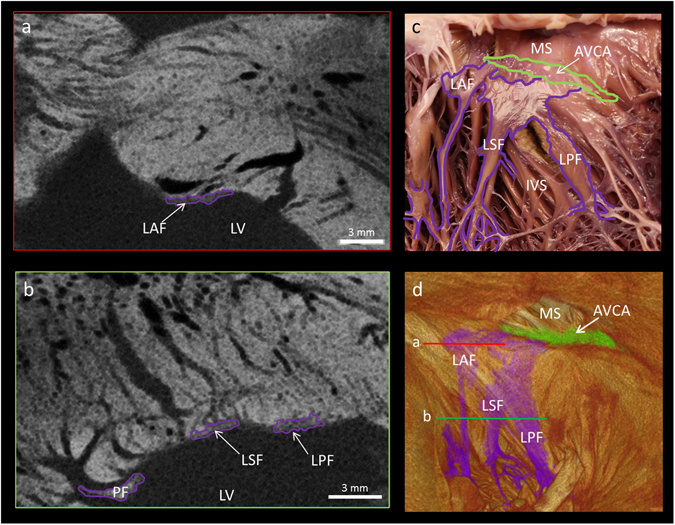
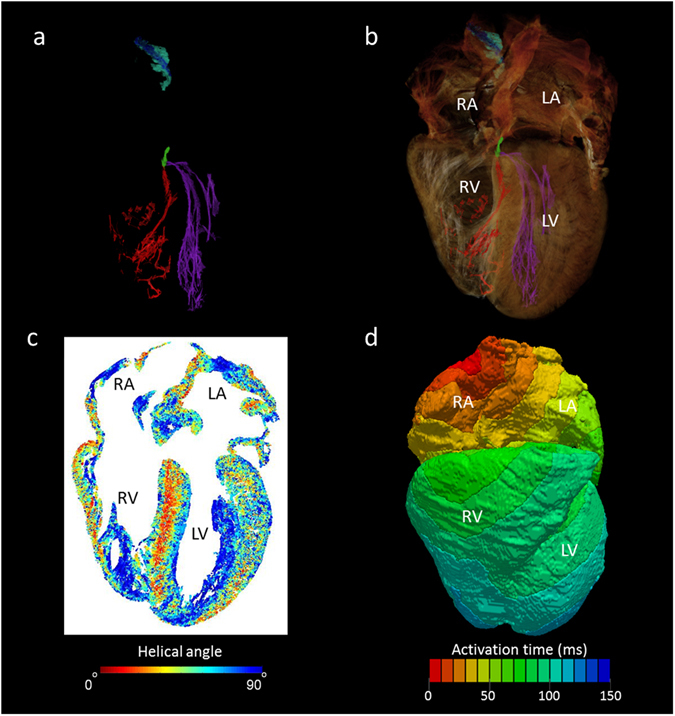
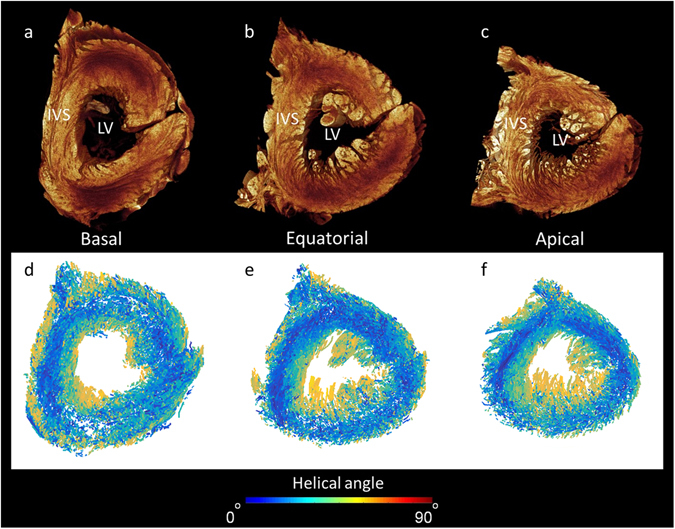
Cardiac arrhythmias and conduction disturbances are accompanied by structural remodelling of the specialised cardiomyocytes known collectively as the cardiac conduction system. Here, using contrast enhanced micro-computed tomography, we present, in attitudinally appropriate fashion, the first 3-dimensional representations of the cardiac conduction system within the intact human heart. We show that cardiomyocyte orientation can be extracted from these datasets at spatial resolutions approaching the single cell. These data show that commonly accepted anatomical representations are oversimplified. We have incorporated the high-resolution anatomical data into mathematical simulations of cardiac electrical depolarisation. The data presented should have multidisciplinary impact. Since the rate of depolarisation is dictated by cardiac microstructure, and the precise orientation of the cardiomyocytes, our data should improve the fidelity of mathematical models. By showing the precise 3-dimensional relationships between the cardiac conduction system and surrounding structures, we provide new insights relevant to valvar replacement surgery and ablation therapies. We also offer a practical method for investigation of remodelling in disease, and thus, virtual pathology and archiving. Such data presented as 3D images or 3D printed models, will inform discussions between medical teams and their patients, and aid the education of medical and surgical trainees.


Conflict of interest statement

The authors declare that they have no competing interests.

Figures

Figure 1
Figure 1
Micro-CT allows objective discrimination of the human sinus node. This figure demonstrates high resolution (28 × 28 × 28 µm3) micro-CT data from part of the right atrium containing the sinus node. For this figure, the sinus node is outlined in yellow in short-axis micro-CT sections (c,d) and in matching histological sections taken from the same sample (a,b). The plane of section in c and d is shown on the 3D volume rendering (endocardial view) (e). The sections are available to view without the outlines in the supplementary Fig. S2. CT- terminal crest, ICV- inferior caval vein, PcM- pectinate muscles, SCV- superior caval vein, SN- sinus node, *- indicates epicardial fat.
Figure 2
Figure 2
Objective segmentation of the human sinus node and its paranodal area. This figure demonstrates high resolution (28 × 28 × 28 µm3) micro-CT data from part of the right atrium containing the sinus node. The extent of the sinus node and its paranodal area is outlined in short-axis (ac) and long-axis (d) micro-CT images. (e) Volume rendering (endocardial view) showing objective segmentation of the low pixel values corresponding to the body of the sinus node in dark blue; pixel values corresponding to the paranodal area are shown in turquoise. The plane of section in a-c is shown on the 3D volume rendering (f). Arrows indicate the approximate seed point for the objective segmentation of the sinus node. Sinus node body length = 14.8mm, width = 4.3mm. The sections are available to view without the outlines in the supplementary Fig. S2. CT- terminal crest, SN- sinus node.
Figure 3
Figure 3
The human atrioventricular conduction axis resolved by micro-CT. This figure demonstrates high resolution (73 × 73 × 73 µm3) micro-CT data from a whole human heart. It shows the 3D extent and location of the segmented atrioventricular conduction axis across the upper surface of the interventricular septum (e). The viewpoint in e is from the atria, looking down into the ventricular chambers. Illustrative long-axis sections from the micro-CT dataset and from corresponding histological sections show the compact node in the right atrium proximally and inferiorly (a,c), becoming the penetrating bundle (b,d), and extending anteriorly and slightly rostrally to become the branching bundle (e). The plane of section in c and d is shown on the 3D volume rendering (e). The sections are available to view without the outlines in the supplementary Fig. S3. Atrioventricular conduction axis colour coding in panel e; turquoise- inferior nodal extension, red- compact node, blue- penetrating bundle, green- branching bundle, purple- dead-end tract. CFB- central fibrous body, CN- compact node, IAS- interatrial septum, IVS- interventricular septum, LV- left ventricle, PB- penetrating bundle, RV- right ventricle, RVOT- right ventricular outflow tract.
Figure 4
Figure 4
Segmentation of the right bundle branch. The high resolution (73 × 73 × 73 µm3) micro-CT data from the whole human heart, showing the 3D extent and position of the segmented right bundle branch (red in panel d) on the lateral aspect of the interventricular septum (c,d), as viewed from within the right ventricular cavity. Illustrative long-axis micro-CT sections showing the proximal (a) and distal (b) aspects of the right bundle branch. From the view in (d) a part of the so-called dead-end tract at the anterior/rostral extent of the atrioventricular conduction axis can be identified (purple). The position of the cross-sections (a,b) are shown in the 3D volume rendering in (c). Ao- Aortic root, AVCA- atrioventricular conduction axis, CS- coronary sinus, IVS- interventricular septum, MS- membranous septum, RBB- right bundle branch.
Figure 5
Figure 5
The fascicular arrangement of the left bundle branch resolved by micro-CT. This figure demonstrates high resolution (73 × 73 × 73 µm3) micro-CT data from a whole human heart. Panels a and b show short axis micro-CT sections of the ribbon-like anterior, septal and posterior fascicles in the planes indicated in the 3D segmentation (d). A comparison between the visual anatomy in a macro photograph and the segmented atrioventricular conduction axis and left sided bundle branches of the same heart is shown in panels c and d. AVCA- atrioventricular conduction axis, IVS- interventricular septum, LV- left ventricular cavity, LAF- left anterior fascicle, LSF- left septal fascicle, LPF, left posterior fascicle, MS- membranous septum, PF- Purkinje fibre.
Figure 6
Figure 6
The 3D anatomy of cardiac conduction system in the intact human heart. This figure demonstrates high resolution (73 × 73 × 73 µm3) micro-CT data. From a single data set, the cardiac conduction system has been segmented (c,d) and overlaid on a semi-transparent or ‘ghosted’ rendering of the myocardium and great vessels (a,b). Panel (a) presents the view from the right side, and panel (b) from the left. The myocardium has been virtually sliced in the longitudinal axis to expose internal structures. Data is presented in the attitudinally correct position for the human, that is, in the upright posture. This 3D dataset is available in the supplementary material as a video (Supplementary Video S1) to demonstrate more clearly the insight that the dataset allows into the anatomical relations between the aortic root, the sinus node, the atrioventricular conduction axis, the atrial and ventricular septa and the bundle branches. Ao- aortic root, AVCA- atrioventricular conduction axis, CS- coronary sinus, FO- fossa ovale, LBB- left bundle branch, LCL- hinge of left coronary leaflet, LPN- left purkinje network, LV- left ventricle, MA- mitral annulus, NCL- hinge of non-coronary leaflet, RBB- right bundle branch, RCL- hinge of right coronary leaflet, RV- right ventricle, RVOT- right ventricular outflow tract, RPN – right Purkinje network, TA- tricuspid annulus.
Figure 7
Figure 7
The utility of whole heart micro-CT data in mathematical modelling of cardiac depolarisation. Panel (a) shows the conducting tissue segmented from human whole heart micro-CT dataset; sinus node (blue), paranodal area (turquoise), atrioventricular conduction axis (green), the right (red) and left (purple) Purkinje networks. Panel (b) places the segmented conduction system in the anatomical context of the surrounding myocardium. Panel (c) shows a four-chamber view of cardiomyocyte orientation in which the absolute helical angles derived from the CT dataset are coded in colour (see colour map). Panel (d) is an illustrative isochrone map of cardiac depolarisation seeded from the sinus node. The model incorporates the anatomically accurate geometry of the myocardium and the accurate disposition of the conduction system with the electrical properties of these various regions derived from published electrophysiological measurements. IAS- interatrial septum, IVS- interventricular septum, LA- left atrium, LV- left ventricle, RA- right atrium, RV- right ventricle.
Figure 8
Figure 8
Extraction of cardiomyocyte orientation in the human left ventricle. Panels a–c show volume renderings in short-axis view taking from the basal, equatorial, and apical regions. Panels d–f show corresponding cardiomyocyte orientation in which the absolute helical angles derived from the CT dataset are coded in colour (see colour map). Note the right ventricular free wall is removed from view. IVS- interventricular septum, LV- left ventricular cavity.

References

    1. Dobrzynski H, et al. Structure, function and clinical relevance of the cardiac conduction system, including the atrioventricular ring and outflow tract tissues. Pharmacol Ther. 2013;139:260–288. doi: 10.1016/j.pharmthera.2013.04.010. - DOI - PubMed
    1. Stephenson RS, et al. The functional architecture of skeletal compared to cardiac musculature: Myocyte orientation, lamellar unit morphology, and the helical ventricular myocardial band. Clin Anat. 2016;29:316–332. doi: 10.1002/ca.22661. - DOI - PubMed
    1. Boyett MR. ‘And the beat goes on’ the cardiac conduction system: the wiring system of the heart. Exp Physiol. 2009;94:1035–1049. doi: 10.1113/expphysiol.2009.046920. - DOI - PubMed
    1. Sanchez-Quintana, D. & Yen H, S. Anatomy of cardiac nodes and atrioventricular specialized conduction system. Revista Espanola de Cardiologia (English Version) 56, 1085–1092, http://www.revespcardiol.org/en/anatomy-of-cardiac-nodes-and/articulo/13... (2003). - PubMed
    1. Chan N-Y. Sudden cardiac death in Asia and China are we different? J Am Coll Cardiol. 2016;67:590–592. doi: 10.1016/j.jacc.2015.12.011. - DOI - PubMed

Publication types