

SDS-assisted protein transport through solid-state nanopores
- PMID: 28776058
- PMCID: PMC5611827
- DOI: 10.1039/c7nr02450a
SDS-assisted protein transport through solid-state nanopores
Abstract
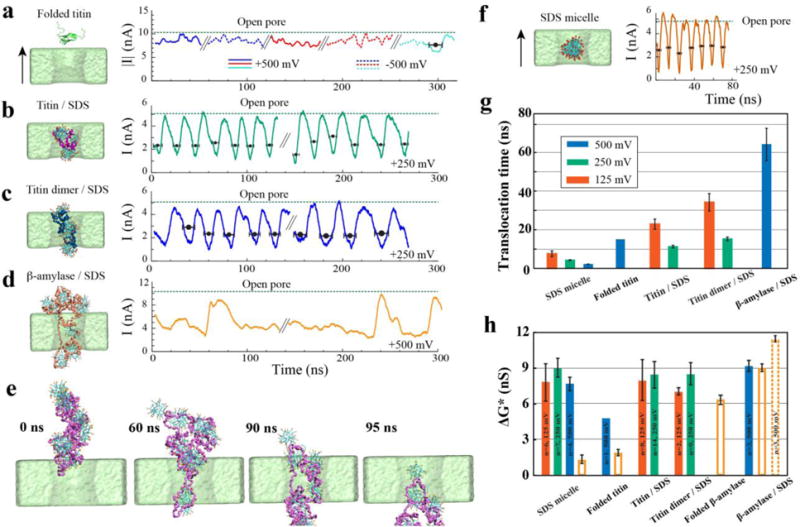
Using nanopores for single-molecule sequencing of proteins - similar to nanopore-based sequencing of DNA - faces multiple challenges, including unfolding of the complex tertiary structure of the proteins and enforcing their unidirectional translocation through nanopores. Here, we combine molecular dynamics (MD) simulations with single-molecule experiments to investigate the utility of SDS (Sodium Dodecyl Sulfate) to unfold proteins for solid-state nanopore translocation, while simultaneously endowing them with a stronger electrical charge. Our simulations and experiments prove that SDS-treated proteins show a considerable loss of the protein structure during the nanopore translocation. Moreover, SDS-treated proteins translocate through the nanopore in the direction prescribed by the electrophoretic force due to the negative charge impaired by SDS. In summary, our results suggest that SDS causes protein unfolding while facilitating protein translocation in the direction of the electrophoretic force; both characteristics being advantageous for future protein sequencing applications using solid-state nanopores.
Figures


Similar articles
-
Single-File Translocation Dynamics of SDS-Denatured, Whole Proteins through Sub-5 nm Solid-State Nanopores.ACS Nano. 2022 Jul 26;16(7):11405-11414. doi: 10.1021/acsnano.2c05391. Epub 2022 Jul 3. ACS Nano. 2022. PMID: 35785960 Free PMC article.
-
Translocation of linearized full-length proteins through an engineered nanopore under opposing electrophoretic force.Nat Biotechnol. 2024 Aug;42(8):1275-1281. doi: 10.1038/s41587-023-01954-x. Epub 2023 Sep 18. Nat Biotechnol. 2024. PMID: 37723268
-
Nanopore Translocation Reveals Electrophoretic Force on Noncanonical RNA:DNA Double Helix.ACS Nano. 2024 Jun 11;18(23):15013-15024. doi: 10.1021/acsnano.4c01466. Epub 2024 May 31. ACS Nano. 2024. PMID: 38822455 Free PMC article.
-
Probing nanopores: molecular dynamics insights into the mechanisms of DNA and protein translocation through solid-state and biological nanopores.Soft Matter. 2025 Mar 26;21(13):2385-2399. doi: 10.1039/d4sm01534g. Soft Matter. 2025. PMID: 40094904 Review.
-
Characterization of protein unfolding with solid-state nanopores.Protein Pept Lett. 2014 Mar;21(3):256-65. doi: 10.2174/09298665113209990077. Protein Pept Lett. 2014. PMID: 24370259 Free PMC article. Review.
Cited by
-
Unlocking the Power of Nanopores: Recent Advances in Biosensing Applications and Analog Front-End.Biosensors (Basel). 2023 May 31;13(6):598. doi: 10.3390/bios13060598. Biosensors (Basel). 2023. PMID: 37366963 Free PMC article. Review.
-
Real-Time Nanopore-Based Recognition of Protein Translocation Success.Biophys J. 2018 Feb 27;114(4):772-776. doi: 10.1016/j.bpj.2017.12.019. Epub 2018 Jan 12. Biophys J. 2018. PMID: 29338842 Free PMC article.
-
Nanopore DNA sequencing technologies and their applications towards single-molecule proteomics.Nat Chem. 2024 Mar;16(3):314-334. doi: 10.1038/s41557-023-01322-x. Epub 2024 Mar 6. Nat Chem. 2024. PMID: 38448507 Review.
-
Strategies for Development of a Next-Generation Protein Sequencing Platform.Trends Biochem Sci. 2020 Jan;45(1):76-89. doi: 10.1016/j.tibs.2019.09.005. Epub 2019 Oct 30. Trends Biochem Sci. 2020. PMID: 31676211 Free PMC article. Review.
-
Molecular Determinants of Current Blockade Produced by Peptide Transport Through a Nanopore.ACS Nanosci Au. 2023 Nov 14;4(1):21-29. doi: 10.1021/acsnanoscienceau.3c00046. eCollection 2024 Feb 21. ACS Nanosci Au. 2023. PMID: 38406313 Free PMC article. Review.
References
MeSH terms
Substances
Grants and funding
LinkOut - more resources
Full Text Sources
Other Literature Sources