. 2017 Nov;92(11):1177-1186.
doi: 10.1002/ajh.24879. Epub 2017 Aug 28.

SIRT1 activates the expression of fetal hemoglobin genes

Affiliations

SIRT1 activates the expression of fetal hemoglobin genes

Yan Dai et al. Am J Hematol. 2017 Nov.

Abstract

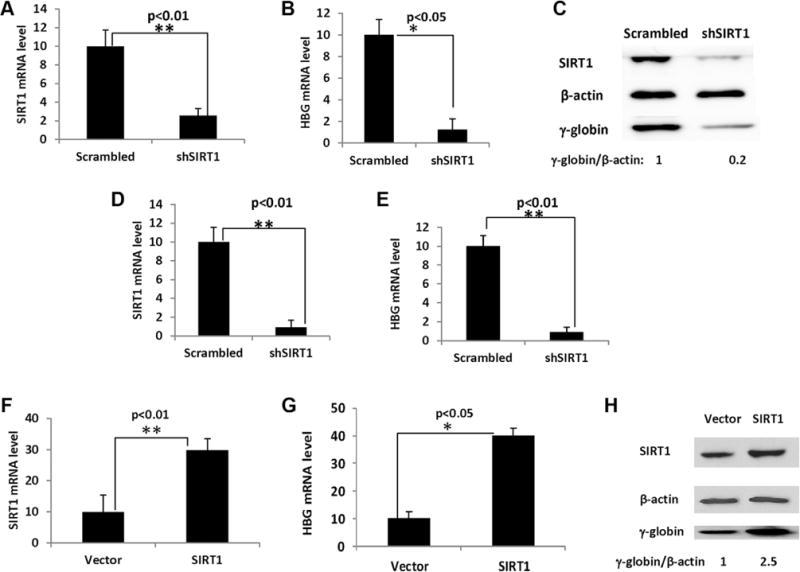
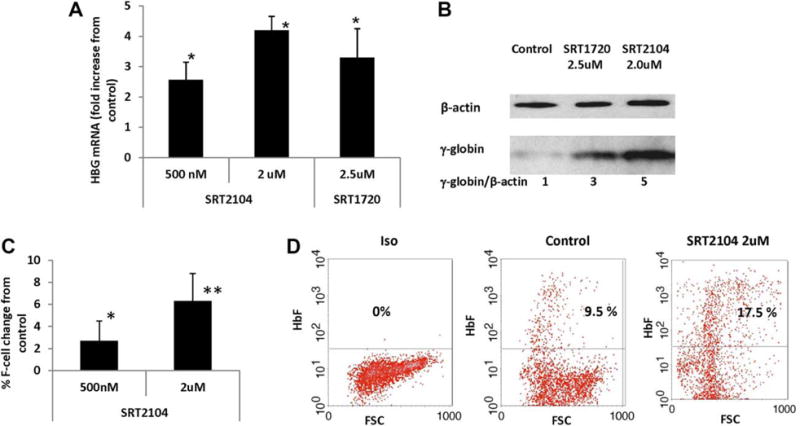
High fetal hemoglobin (HbF, α2 γ2 ) levels ameliorate the clinical manifestations of sickle cell disease and β thalassemia. The mechanisms that repress HbF expression and silence γ-globin genes in adults are incompletely characterized and only a single HbF inducer, hydroxyurea, is approved for treatment, and only in patients with sickle cell disease. We identified SIRT1, a protein deacetylase, as a new inducer of γ-globin. SIRT1 knockdown decreased, while SIRT1 ectopic expression upregulated γ-globin gene (HBG) expression in primary human erythroid cells and in K562 cells. The small molecule SIRT1 activators SRT2104 and SRT1720 enhanced HBG expression in cord blood human erythroblasts and reactivated silenced HBG in adult human erythroblasts. Furthermore, SIRT1 binds in the β-globin gene cluster locus control region (LCR) and HBG promoters, promotes the looping of the LCR to HBG promoter, and increases the binding of RNA polymerase II and H4K16Ac in the HBG promoter. SIRT1 suppressed the expression of the HBG suppressors BCL11A, KLF1, HDAC1 and HDAC2. Lastly, SIRT1 did not change the proliferation of human erythroid progenitor cells or the expression of differentiation marker CD235a. These data suggest that SIRT1 activates HBG expression through facilitating LCR looping to the HBG promoter, inhibiting the expression of transcriptional suppressors of HBG, and indirectly increasing histone acetylation in the HBG promoter. SIRT1 is a potential therapeutic target for γ-globin gene induction, and small molecule SIRT1 activators might serve as a lead compound for the development of new HbF inducers.


Conflict of interest statement

CONFLICT OF INTEREST

The authors declare no competing financial interests.

Figures

FIGURE 1
FIGURE 1
SIRT1 knockdown decreased while SIRT1 ectopic expression increased HBG expression. Erythroid progenitor cells from cord blood expressing either SIRT1 shRNA or scrambled shRNA were collected on day 12 of culture phase 2 for mRNA analysis and collected on day 14 for g-globin protein analysis (A-C). (A) SIRT1 mRNA level in erythroid cells expressing SIRT1 shRNA or scrambled shRNA. SIRT1 mRNA is normalized to 18S. **P < .01. Error bars indicate SD. N = 4. (B) SIRT1 knockdown in erythroid cells reduces HBG mRNA. HBG mRNA is normalized to HBG + HBB. **P < .01. Error bars indicate SD. N = 4. (C) Effects of SIRT1 knockdown on g-globin protein levels in erythroid cells. The ratio of γ-globin: β-actin protein is shown below the panel. (D) SIRT1 mRNA level in K562 cells expressing SIRT1 shRNA or scrambled shRNA. SIRT1 mRNA is normalized to 18S. **P < .01. Error bars indicate SD. N = 3. (E) SIRT1 knockdown in K562 cells reduces HBG mRNA. HBG mRNA is normalized to 18S. **P < .01. Error bars indicate SD. N = 3. Erythroid progenitors cells from cord blood infected with retrovirus containing either pBABE-SIRT1 or empty pBABE-vector control were collected on day 12 of phase 2 for mRNA analysis and collected on day 14 for γ-globin protein analysis (F-H). (F) SIRT1 mRNA level in erythroid cells expressing pBABE-SIRT1 or empty pBABE vector. SIRT1 mRNA is normalized to 18S. **P<.01. Error bars indicate SD. N = 4. (G) SIRT1 ectopic expression in erythroid cells increases HBG mRNA. The HBG mRNA is normalized to HBG + HBB. **P < .05. Error bars indicate SD. N = 4. (H) Effects of SIRT1 ectopic expression on γ-globin protein levels. The ratio of g-globin: β-actin protein is shown below the panel
FIGURE 2
FIGURE 2
Small molecule SIRT1 activators induced HBG expression in erythroid progenitors from cord blood. Erythroid progenitors from cold blood were cultured in a two-phase system. On day 4 of erythroid differentiation phase (phase 2), the cells were treated with SRT2104 or SRT1720 at indicated concentration or vehicle control. The cells were collected on day 12 of phase 2 for mRNA analysis and on day 14 for F-cell and g-gloin protein analysis. (A) SIRT1 activator SRT2104 induces HBG mRNA. HBG mRNA is normalized to 18S. Error bars indicate SD. N = 4. (B) SIRT1 activator SRT1720 induces HBG mRNA. HBG mRNA is normalized to 18S. Error bars indicate SD. N = 4. (C) Effects of SIRT1 activators SRT2104 and SRT1720 on γ-globin protein levels. The ratio of γ-globin: β-actin protein is shown below the panel. (D) Mean change of F-cell in erythroid progenitor cells treated with SRT2104, compared with control cells from the same subject. Error bars indicate SD. N = 4. (E) Representative of Flow Cytometry profile showing SRT2104 increases F-cell proportions. (F) SIRT1 activators regulate SIRT1 deacetylase activity. The cells treated with SRT2104 at 2 uM or SRT1720 at 5 uM or vehicle control were collected on day 12 of phase 2, the cell lysates prepared and immunoblotted with anti-Ac-p53, p53 or β-actin antibodies [Color figure can be viewed at wileyonlinelibrary.com]
FIGURE 3
FIGURE 3
Small molecule SIRT1 activators reactivated silenced HBG expression in adult erythroid progenitors. Erythroid progenitors from adult PBMC were cultured in a 2-phase culture system. On day 4 of erythroid differentiation phase (phase 2), the cells were treated with SRT 2104 or SRT1720 at indicated concentration or vehicle control. The cells were collected on day 12 of phase 2 for mRNA analysis and on day 14 for F-cell and γ-globin analysis. (A) SIRT1 activator SRT2104 and SRT1720 induced HBG mRNA in adult erythroid cells. HBG mRNA is normalized to HBG+HBB. *P < .05. Error bars indicate SD. N = 4. (B) Effects of SIRT1 activators SRT2104 and SRT1720 on γ-globin protein levels in adult erythroid cells. The ratio of γ-globin: β-actin protein is shown below the panel. (C) Mean change in proportions of cells expressing HbF in adult erythroid cells treated with SRT2104, compared with control cells from the same subject. Error bars indicate SD. N = 6. **P < .01 and *P < .05. (D) Representative of flow cytometric profiles showing SRT2104 increased F-cell proportions in adult erythroid cells [Color figure can be viewed at wileyonlinelibrary.com]
FIGURE 4
FIGURE 4
SIRT1 binding in the LCR and the HBG promoter, activated the HBG promoter and regulated LCR looping to the HBG promoter. (A) ChIP assay examining SIRT1 binding to the LCR and HBG promoter in K562 cells. Sonicated DNA from SIRT1 knockdown (shSIRT1) or scrambled shRNA infected K562 cells (Scrambled) was precipitated with anti-SIRT1 antibody or control IgG. The abundance of DNA precipitated with anti-SIRT1 antibody was normalized to that precipitated with IgG. Cont: internal control sequence. Error bars indicate SD, N = 3. (B) ChIP assay examining histone acetylation and Pol II binding in HBG promoter in K562 cells. Sonicated DNA from SIRT1 knockdown (shSIRT1) or scrambled shRNA infected K562 cells (Scrambled) was precipitated with anti-H3K9Ac, anti-H4K16Ac, and Pol II antibody or control IgG. The abundance of DNA precipitated with antibodies was normalized to that precipitated with IgG. Error bars indicate SD, N = 3. (C) SIRT1 knockdown in K562 cells decreased the looping of LCR to HBG promoter. 3C assay measuring crosslinking frequencies between the LCR and HBG or HBD in K562 cells expressing SIRT1 (scrambled) or SIRT1 knockdown cells (shSIRT1). The EcoRI fragment containing HS of the LCR (black bar) was used as the anchor region. Its crosslinking frequency with EcoRI fragments that contain HBG or HBD was assessed. Each 3C value was normalized to tubulin; The interaction frequencies between the anchor fragment and the fragment encompassing the HBG from the scrambled control sample were set to one. HBG or HBD are depicted on the bottom of the graph, with chromosomal position coordinates. The EcoRI digestion sites are depicted as black triangles. Error bars indicate SEM (n = 3). (D) SIRT1 activators decreased HBG suppressor gene expression. Erythroid progenitor cells from cord blood were treated with SRT2104 at day 4 of phase 2 and harvested for mRNA purification at day 12 of erythroid differentiation (phase 2). cDNA was synthesized and qRT-PCR were performed with primers for BCL11A, HDAC1, HDAC2 and KLF1. mRNA was normalized to 18S. Error bars indicate SD. N = 3

Similar articles

Cited by

References

    1. Steinberg MH, Sebastiani P. Genetic modifiers of sickle cell disease. Am J Hematol. 2012;87:795–803. - PMC - PubMed
    1. Lettre G, Bauer DE. Fetal haemoglobin in sickle-cell disease: from genetic epidemiology to new therapeutic strategies. Lancet. 2016;387:2554–2564. - PubMed
    1. Noguchi CT, Rodgers GP, Serjeant G, Schechter AN. Levels of fetal hemoglobin necessary for treatment of sickle cell disease. N Engl J Med. 1988;318:96–99. - PubMed
    1. Sankaran VG. Targeted therapeutic strategies for fetal hemoglobin induction. Hematology/the Education Program of the American Society of. Hematology Am Soc Hematol Educ Program. 2011;2011:459–465. - PubMed
    1. Bauer DE, Kamran SC, Orkin SH. Reawakening fetal hemoglobin: prospects for new therapies for the beta-globin disorders. Blood. 2012;120:2945–2953. - PMC - PubMed

MeSH terms