Clinical Trial
. 2017 Oct;108(10):2022-2029.
doi: 10.1111/cas.13343. Epub 2017 Aug 28.

Mogamulizumab for relapsed adult T-cell leukemia-lymphoma: Updated follow-up analysis of phase I and II studies

Affiliations
Clinical Trial

Mogamulizumab for relapsed adult T-cell leukemia-lymphoma: Updated follow-up analysis of phase I and II studies

Takashi Ishida et al. Cancer Sci. 2017 Oct.

Abstract

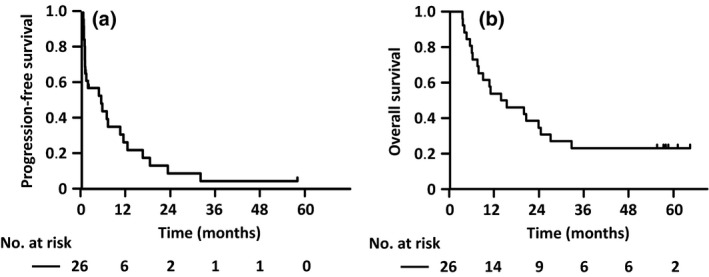
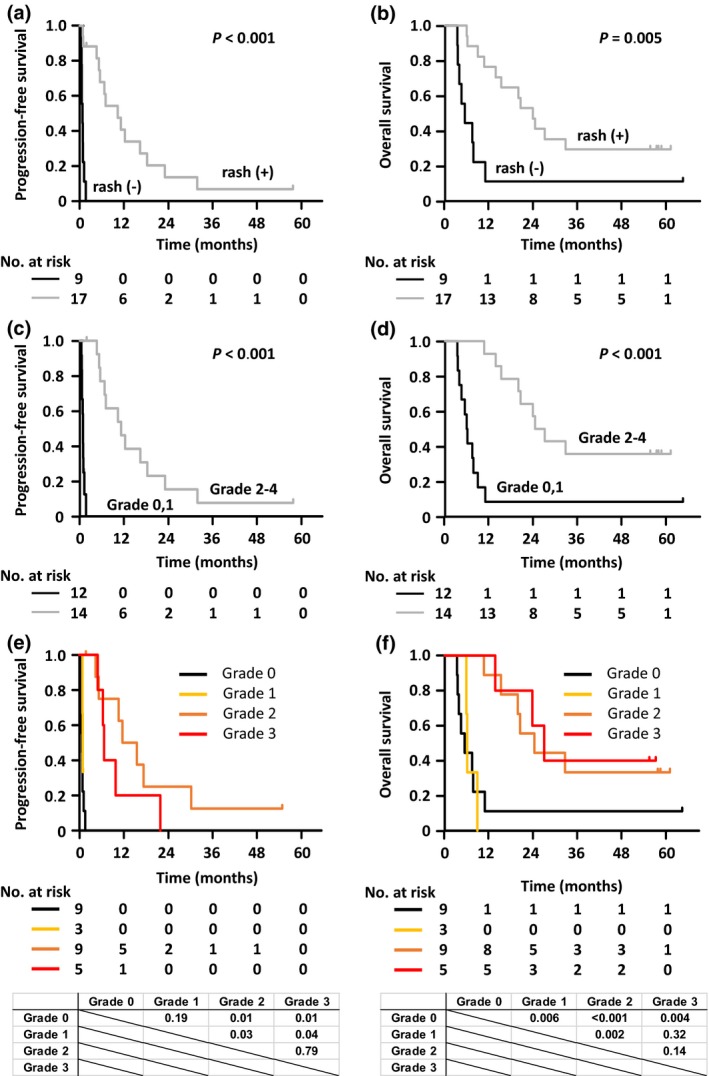
The present study sought to elucidate the prognosis of adult T-cell leukemia-lymphoma (ATL) patients receiving mogamulizumab, a defucosylated anti-CCR4 monoclonal antibody. Progression-free survival (PFS) and overall survival (OS) of ATL patients enrolled in two studies are herein updated, namely NCT00355472 (phase I study of mogamulizumab in relapsed patients with ATL and peripheral T-cell lymphoma) and NCT00920790 (phase II study for relapsed ATL). Of 13 patients with relapsed aggressive ATL in the phase I study, four (31%) survived >3 years. For 26 relapsed patients with aggressive ATL in the phase II study, median PFS was 5.2 months and 1-year PFS was 26%, whereas median OS was 14.4 months, and 3-year OS was 23%. For patients without a rash or who developed a grade 1 rash only, median PFS was 0.8 months, and 1-year PFS was zero, with a median OS of 6.0 months, and 3-year OS of 8%. In contrast, for patients who developed a rash ≥grade 2, median PFS was 11.7 months, and 1-year PFS was 50%, with a median OS of 25.6 months, and 3-year OS of 36%. Thus, we conclude that mogamulizumab monotherapy may improve PFS and OS in some patients with relapsed aggressive ATL, especially those who develop a skin rash as a moderate immune-related adverse event. Therefore, further investigation is warranted to validate the present observations and to clarify the mechanisms involved in the activity of mogamulizumab.

Keywords: Adult T-cell leukemia-lymphoma; CC chemokine receptor 4; mogamulizumab; rash; regulatory T cell.


Figures

Figure 1
Figure 1
Progression‐free survival (PFS) and overall survival (OS) of all relapsed adult T‐cell leukemia–lymphoma (ATL) patients enrolled in the phase II study. (a) PFS curves for all relapsed ATL patients enrolled in the phase II study. Median PFS was 5.2 months (95% confidence interval [CI], 0.9–10.3 months), and the PFS rate at 1 year was 26% (95% CI, 11%–45%). (b) OS curves of all relapsed ATL patients enrolled in the phase II study. Median OS was 14.4 months (95% CI, 7.4–24.3 months), and the OS rate at 3 years was 23% (95% CI, 9%–40%).
Figure 2
Figure 2
Progression‐free survival (PFS) and overall survival (OS) in relapsed adult T‐cell leukemia–lymphoma (ATL) patients according to the presence of skin rash. (a) PFS curves for relapsed ATL patients who did (+)/did not (–) develop a skin rash are shown. For patients who did not develop a rash after 1 year, median PFS was 0.8 months (95% confidence interval [CI], 0.4–1.2 months), and PFS rate was 0%. For patients who developed rashes after 1 year, median PFS was 10.3 months (95% CI, 5.2–18.2 months), and PFS rate was 41% (95% CI, 17%–63%). (b) OS curves for ATL patients who did/did not develop a skin rash are shown. For patients who did not develop a rash after 3 years, median OS was 5.4 months (95% CI, 3.3–10.8 months), and OS rate was 11% (95% CI, 1%–39%). For patients who developed rashes after 3 years, median OS was 23.7 months (95% CI, 10.6 months–not estimated [NE]), and the OS rate was 29% (95% CI, 11%–51%). (c) PFS curves for ATL patients who did not develop a rash or who developed a grade 1, or a grade 2 or higher skin rash are shown. For patients who did not develop a rash or who developed grade 1 rashes after 1 year, median PFS was 0.8 months (95% CI, 0.4–1.2 months), and PFS rate was 0%. For patients who developed a grade 2 or higher rash after 1 year, median PFS was 11.1 months (95% CI, 5.5–18.2 months), and PFS rate was 46% (95% CI, 19%–70%). (d) OS curves for ATL patients who did not develop a rash or who developed a grade 1, or a grade 2 or higher skin rash are shown. For patients who did not develop a rash or who developed a grade 1 rash after 3 years, median OS was 6.0 months (95% CI, 3.5–8.8 months), and OS rate was 8% (95% CI, 1%–31%). For patients who developed a grade 2 or higher rash after 3 years, median OS was 25.6 months (95% CI, 15.2 months–NE), and OS rate was 36% (95% CI, 13%–59%). (e) PFS curves for relapsed ATL patients who did not develop a rash or who developed grade 1, 2, or 3 skin rashes are shown. Median PFS and PFS rates at 1 year in patients who did not develop a rash or who developed grade 1, 2, or 3 rashes were 0.8 months (95% CI, 0.4–1.2 months) and 0%, 0.9 months (95% CI, 0.8 months–NE) and 0%, 14.3 months (95% CI, 4.6–31.8 months) and 63% (95% CI, 23%–86%), and 7.0 months (95% CI, 5.2–23.0 months) and 20% (95% CI, 1%–58%), respectively. (f) OS curves for ATL patients who did not develop a rash or who developed grade 1, 2, or 3 rashes are shown. Median OS and OS rates at 3 years in patients who did not develop a rash or who developed grade 1, 2, or 3 rashes were 5.4 months (95% CI, 3.3–10.8 months) and 11% (95% CI, 1%–39%), 6.1 months (95% CI, 5.9–8.8 months) and 0%, 24.3 months (95% CI, 10.6 months–NE) and 33% (95% CI, 8%–62%), and 27.0 months (95% CI, 13.7 months–NE) and 40% (95% CI, 5%–75%), respectively. PFS and OS curves were compared using a log–rank test and the P‐values calculated between each curve are indicated in the lower panel.

References

    1. Vose J, Armitage J, Weisenburger D. International peripheral T‐cell and natural killer/T‐cell lymphoma study: pathology findings and clinical outcomes. J Clin Oncol 2008; 26: 4124–30. - PubMed
    1. Swerdlow SH, Campo E, Pileri SA et al The 2016 revision of the World Health Organization (WHO) classification of lymphoid neoplasms. Blood 2016; 127: 2375–90. - PMC - PubMed
    1. Shimoyama M. Diagnostic criteria and classification of clinical subtypes of adult T‐cell leukaemia‐lymphoma: a report from the Lymphoma Study Group (1984–87). Br J Haematol 1991; 79: 428–37. - PubMed
    1. Tsukasaki K, Hermine O, Bazarbachi A et al Definition, prognostic factors, treatment, and response criteria of adult T‐cell leukemia‐lymphoma: a proposal from an international consensus meeting. J Clin Oncol 2009; 27: 453–9. - PMC - PubMed
    1. Uchiyama T, Yodoi J, Sagawa K, Takatsuki K, Uchino H. Adult T‐cell leukemia: clinical and hematologic features of 16 cases. Blood 1997; 50: 481–92. - PubMed

Publication types

Substances

LinkOut - more resources